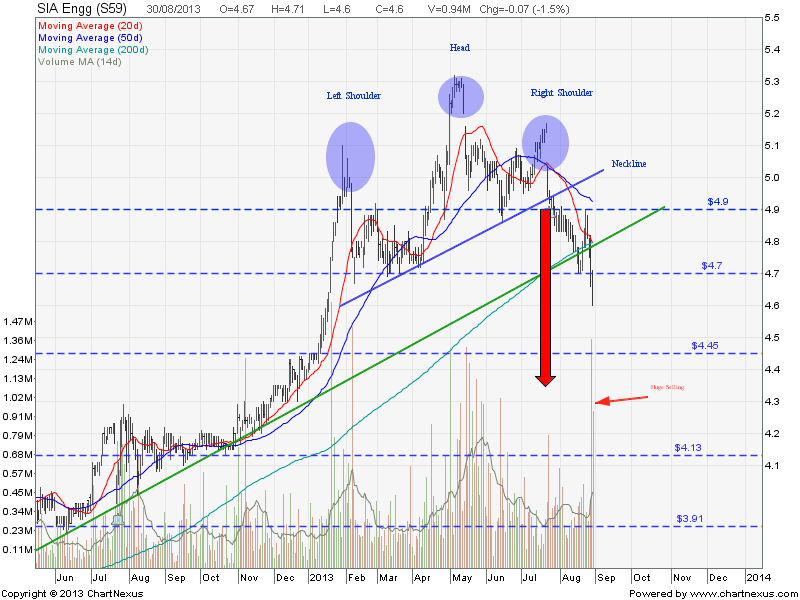
SIA Engineering: Head and Shoulders
SIA Engineering broke the head and shoulders neckline ($4.90 or $4.70 depends on how you draw the neckline) and also the 200D SMA support with a spike in selling volume. Price target of this break down is minimum $4.35. Happy Shorting!
You are going to miss big time if you still do not know how to short (Sell High, Buy Low) Singapore stocks using CFD.
Want to find out more about CFD trading, click here to contact Rebecca Goh to ask for demo.
Key Statistics for SIE
| Current P/E Ratio (ttm) | 18.8912 |
|---|---|
| Estimated P/E(03/2014) | 17.8988 |
| Relative P/E vs. FSSTI | 1.5243 |
| Earnings Per Share (SGD) (ttm) | 0.2435 |
| Est. EPS (SGD) (03/2014) | 0.2570 |
| Est. PEG Ratio | 4.0679 |
| Market Cap (M SGD) | 5,118.26 |
| Shares Outstanding (M) | 1,112.67 |
| 30 Day Average Volume | 404,100 |
| Price/Book (mrq) | 3.6705 |
| Price/Sale (ttm) | 4.4749 |
| Dividend Indicated Gross Yield | 4.78% |
| Cash Dividend (SGD) | 0.1500 |
| Last Dividend | 07/23/2013 |
| 5 Year Dividend Growth | 1.92% |
| Next Earnings Announcement | 10/30/2013 |