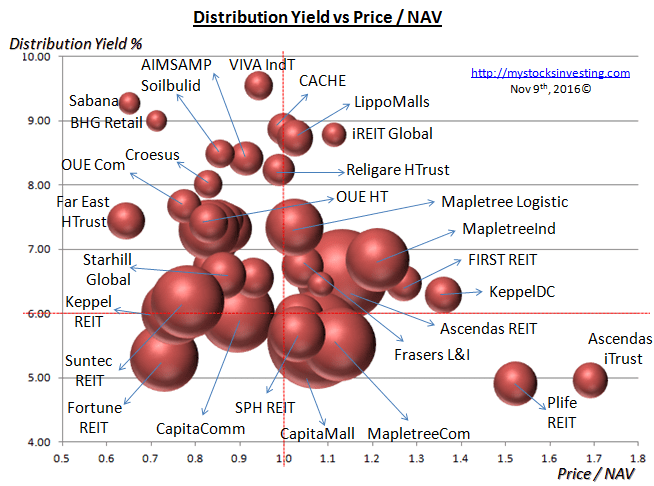
Bubble chart derived from Nov 5, 2016 Singapore REITs Fundamental Comparison Table. There are no significant changes compare to previous Singapore REIT Bubble Chart. Those small cap Singapore REITs with > 8% distribution yield are Sabana Reit (M1GU), AIMSAMP Cap Reit (O5RU), Viva Ind Tr (T8B), Lippo Malls Tr (D5IU), BHG Retail Reit (BMGU), Croesus RTrust (S6NU), SoilbuildBizReit (SV3U) $IREIT Global(UD1U) and RHT HealthTrust(RF1U)
These Bubble Charts are used to show the “relative” position compare to other Singapore REITs.
Two visual bubble charts to pick and avoid:
- Undervalue Singapore REITs with High Distribution Yield** (Value Pick)
- Overvalue Singapore REITs with High Gearing Ratio (Risk Avoidance)
** Distribution Yield are lagging.
Original Post from https://mystocksinvesting.com
Disclaimer: The analysis is for Author own use and NOT to be used as Buy / Sell recommendation. Get a proper training on “How to use this Singapore REIT Bubble Charts?” here.


