Technical Analysis of FTSE ST REIT Index (FSTAS8670)
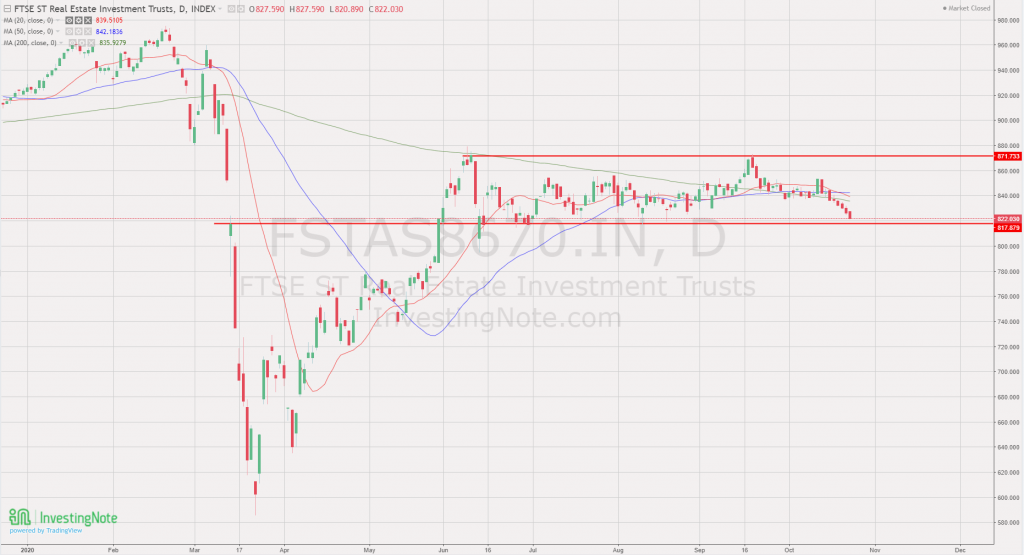
FTSE ST Real Estate Investment Trusts (FTSE ST REIT Index) decreased slightly from 854.51 to 822.03 (-3.80%) compared to last month update. REIT Index has rebounded c45% as of Sep 21 from the bottom on Mar 23, 2020.
Currently the REIT index is currently trading on sideway consolidation, sandwiched between a very tight range between 817 support and 871 resistance. There is a Bollinger Band Squeeze with very tight range and low volatility on FTSE ST REIT Index. The index can start big move in either direction.
There was a false Golden Cross 20D/50D/200D SMA breakout and unable to kick start the uptrend of the REIT index. Currently REIT index is trading near to the critical support at about 817.
As for now, Short term direction: Sideway, until breakout of the resistance (starts up trend) or breakdown of the support (starts down trend).

Previous chart on FTSE ST REIT index can be found in the last post Singapore REIT Fundamental Comparison Table on Sep 21, 2020.


Hi Kenny
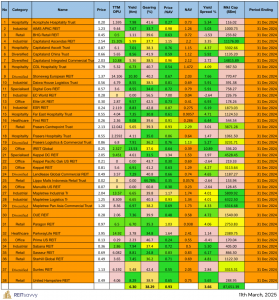
I am looking at your reits table for the first time. May I check what each color coding on the table mean ?
Thank you.
Yau
Green color is favorable and red color is less favorable.
This gives me a quick glance for my own research on the state of health of the REITs.