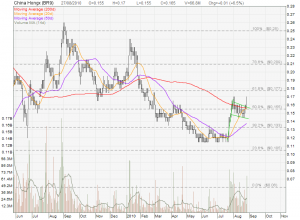
China HongXing looks like breaking out from a Flag pattern with a spike in trading volume. The stock also breaks the 200D MA resistance which is also 50D MA resistance. Other technical indicators like MACD, Bollinger Band, Parabolic SAR, Stochastic, RSI show bullish signal. Also take note that 20D MA crosses up 200D MA, which is another bullish momentum signal. It looks like China HongXing is starting a bull run!


A true flag pattern should have a very significant decrease in volume during the formation of the flag.
This heavy volume with sideways prices after a decline resembles more an accumulation pattern.
I would like to see $0.16 holding support before buying.
The advance today stalled at the 62% Fibo level.
MACD histogram is showing bearish divergence.
MACD line tracing out double tops.
RSI, ROC and momentum all showing bearish divergence.
RL, I take another look at the chart pattern. See a Cup and Handle and long term down trend. Will post the chart.