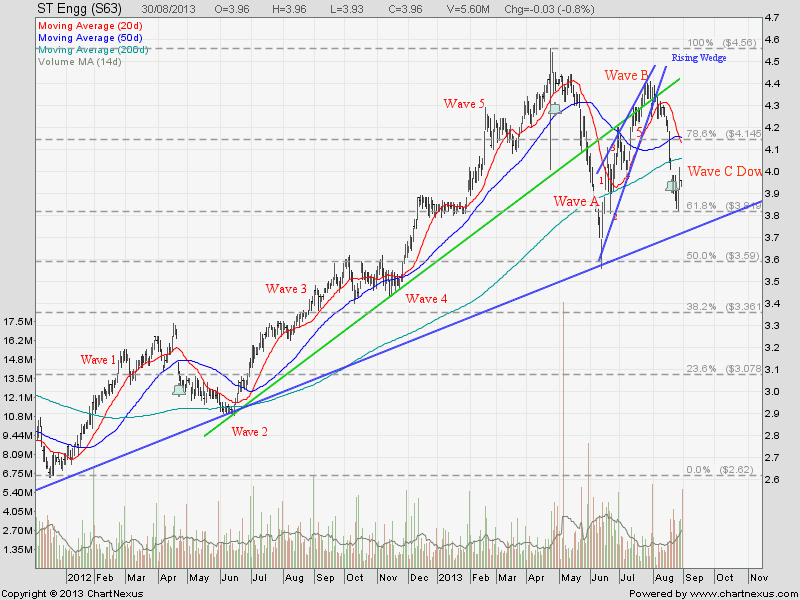
It is coming! Elliott Wave C down!
- Next support $3.70-$3.80 region (also the uptrend support line), followed by $3.59 the previous low.
- Resistance at $4.00 psychological resistance, 200D SMA, 50D SMA, 20D SMA between $4.05-$4.15.
See previous post of ST Engineering – Elliott Wave C Down.
You are going to miss big time if you still do not know how to short (Sell High, Buy Low) Singapore stocks using CFD.
Want to find out more about CFD trading, click here to contact Rebecca Goh to ask for demo.


Perfect.
Time to buy more ST Engg!!!
now is the ‘minor’ correction wave of the wave c, once it is over, should have large plunge.
KK,
How should we interpret the ST chart now? I am confused.
Anyway thought I’d share a trade idea with you. SIA $10 support has turned resistance (i think). can initiate SHORT position.
-student.
You should be able to see STI rebound from a long term trend support line, and also trading within a Falling Wedge. STI upside will be capped by the Falling Wedge resistance and supported by long term trend support at about 3000.
SIA wait for trend reversal candlestick to short. Doji today!
I have been waiting for the rebound for quite some time also! 🙂
hi KK,
Aiyo i was referring to ST Engineering chart, not STI chart! haha
There will be mini Elliott Wave of Wave C.
Focus on the chart pattern and use support / resistance to trade.
Turn off other indicators, else you will be very confused.
thanks kk for being patient in your answers. i am still learning. hope i am not being a nuisance to you, after all i am just generating interest as well =)
KK,
ST Eng seems very very bullish, broke through resistance. Is this a trend reversal? Thx.
don’t get caught with one day rally due to news.
FOMC meeting in few days time and the market can be very volatile.
Wait for the dust settle first to see clear trend.
I shorted at $4.00 because I did not want to miss big time. Now already more than $4.05-$4.15. Should I cut loss now?
@student2: I think you are breaking A LOT of rules before you enter the trade. You are entering the trade base on what you “think”, this is absolutely wrong. You only trade base on what you “see” on the chart with confirmation. In addition, you are entering trade “without” setting stop loss.
Suggest you look at the support & resistance again to see whether you are able to minimise the losses.
I hope you learned a lot from this trade.
Hi KK,
Recently the price of ST has been around $4.23. When you mention look at only resistance & support, from what I see, $4.20 is a strong support point. Does it mean once it breaks that support point, we should short immediately? And since $4.30 seems to be a resistance point, we should buy when it breaks through the resistance point? thx
I have replied you in your personal email.