UOB: Double Tops

  • Post author:

Original post from https://mystocksinvesting.com

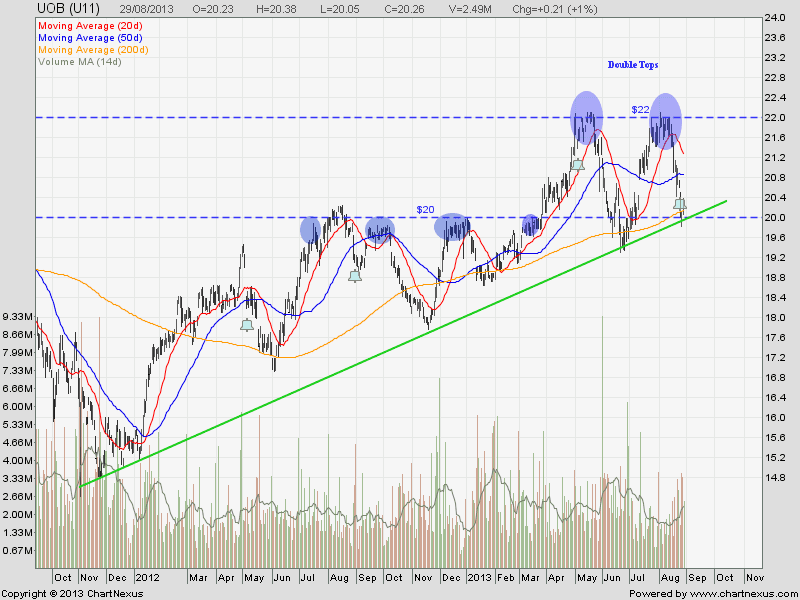
I love UOB chart because I can trade either direction!

Currently UOB has just rebounded from the uptrend support with next significant resistance at $22. Alternatively, UOB can go as low as $18 if the uptrend support (also the neckline of the Double Tops & 200D SMA support) is broken at about $20.

Simply love it!

2013Aug29-UOB-800x600

Key Statistics for UOB

Current P/E Ratio (ttm) 11.3501
Estimated P/E(12/2013) 11.4918
Relative P/E vs. FSSTI 0.9236
Earnings Per Share (SGD) (ttm) 1.7850
Est. EPS (SGD) (12/2013) 1.7630
Est. PEG Ratio 1.6034
Market Cap (M SGD) 31,914.11
Shares Outstanding (M) 1,575.23
30 Day Average Volume 1,910,367
Price/Book (mrq) 1.3496
Price/Sale (ttm) 3.7070
Dividend Indicated Gross Yield 2.96%
Cash Dividend (SGD) 0.2000
Last Dividend 08/26/2013
5 Year Dividend Growth 1.49%
Next Earnings Announcement 11/05/2013
Continue ReadingUOB: Double Tops

Bank of America (BAC): Double Tops at Sight!

  • Post author:

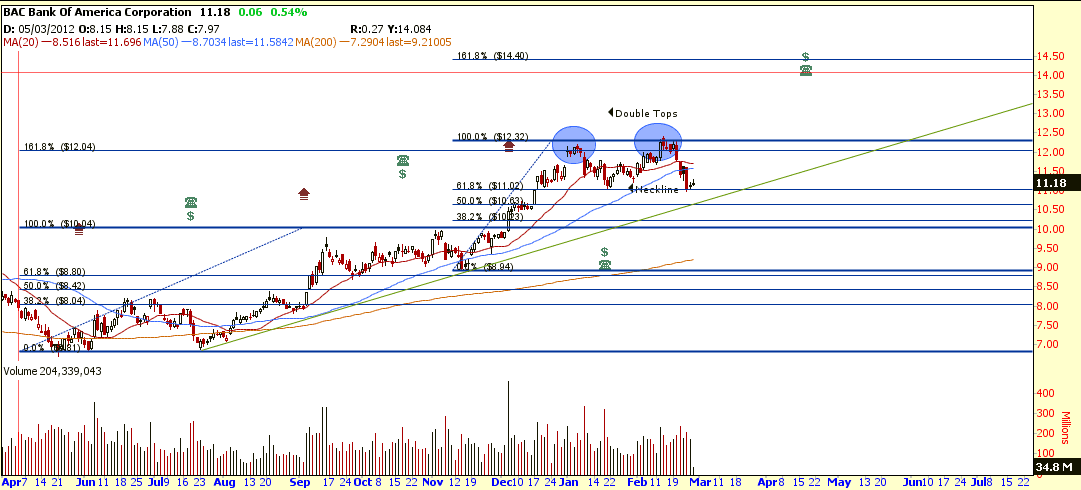
Bank of America (BAC) is forming a Double Tops with neckline at about $11.00. If BAC rebound from this neckline (also the 61.8% FR), BAC will continue the uptrend with price target of $14.40 (161.8% FR). If BAC break below $11.00 support, the price target of this Double Tops breakout is about $10.00

Key Statistics for BAC

Current P/E Ratio (ttm) 12.2033
Estimated P/E(12/2013) 11.2814
Relative P/E vs. SPX 0.8262
Earnings Per Share (USD) (ttm) 0.9200
Est. EPS (USD) (12/2013) 0.9950
Est. PEG Ratio 1.3017
Market Cap (M USD) 121,007.57
Shares Outstanding (M) 10,778.26
30 Day Average Volume 157,886,592
Price/Book (mrq) 0.5546
Price/Sale (ttm) 1.2045
Dividend Indicated Gross Yield 0.36%
Cash Dividend (USD) 0.0100
Last Dividend 02/27/2013
5 Year Dividend Growth -55.91%
Next Earnings Announcement 04/17/2013
Continue ReadingBank of America (BAC): Double Tops at Sight!

Noble Group: How Low can the Share Price Go?

  • Post author:

Noble Group is currently trading at 3 years low after breaking out from Double Tops chart pattern. Currently the chart is very bearish. If the current support is broken, next supports will be $0.879 (138.2% FR), $0.823 (150% FR) and $0.766 (161.8% FR).

Key Statistic:

Current P/E Ratio (ttm) 11.4263
Estimated P/E(12/2012) 11.0729
Relative P/E vs.FSSTI 1.0183
Earnings Per Share (USD) (ttm) 0.0756
Est. EPS (USD) (12/2012) 0.0780
Est. PEG Ratio 0.3210
Market Cap (M SGD) 6,880.74
Shares Outstanding (M) 6,491.27
30 Day Average Volume 48,495,570
Price/Book (mrq) 1.1014
Price/Sale (ttm) 0.0613
Dividend Indicated Gross Yield 1.96%
Cash Dividend (USD) 0.0165
Last Dividend 05/15/2012
5 Year Dividend Growth 12.83%
Next Earnings Announcement 02/28/2013
Continue ReadingNoble Group: How Low can the Share Price Go?