Capitaland: Elliott Wave 5 Now?

  • Post author:

Capitaland has been following a nice Elliott Wave with nice Fibonacci Retracement (61.8%, 161.8%). There is a change to have an almost perfect Elliott Wave 1-5 pattern if Capitaland can stay above the 20D SMA to reach the 261.8% target of $3.31. Alternatively, if Capitaland break the uptrend channel support & 20D SMA at about $3.00, the Elliott Wave has to be redrawn to be Wave C.

  • Immediate Resistance to watch: $3.15
  • Immediate Support to watch: $3.00


Key Statistics for CAPL

Current P/E Ratio (ttm) 12.1344
Estimated P/E (12/2012 ) 21.4685
Earnings Per Share (SGD) (ttm) 0.2530
Est. EPS (SGD) (12/2012) 0.1430
Est. PEG Ratio 0.7878
Market Cap (M SGD) 13,048.96
Shares Outstanding (M) 4,250.47
Enterprise Value (M SGD) (ttm) 25,638.30
Enterprise Value/EBITDA (ttm) 35.08
Price/Book (mrq) 0.8632
Price/Sale (ttm) 4.1151
Dividend Indicated Gross Yield 1.9544
Next Earnings Announcement 10/19/2012
Continue ReadingCapitaland: Elliott Wave 5 Now?

F&N: Up Trend Still Intact But Need to be Cautious!

  • Post author:

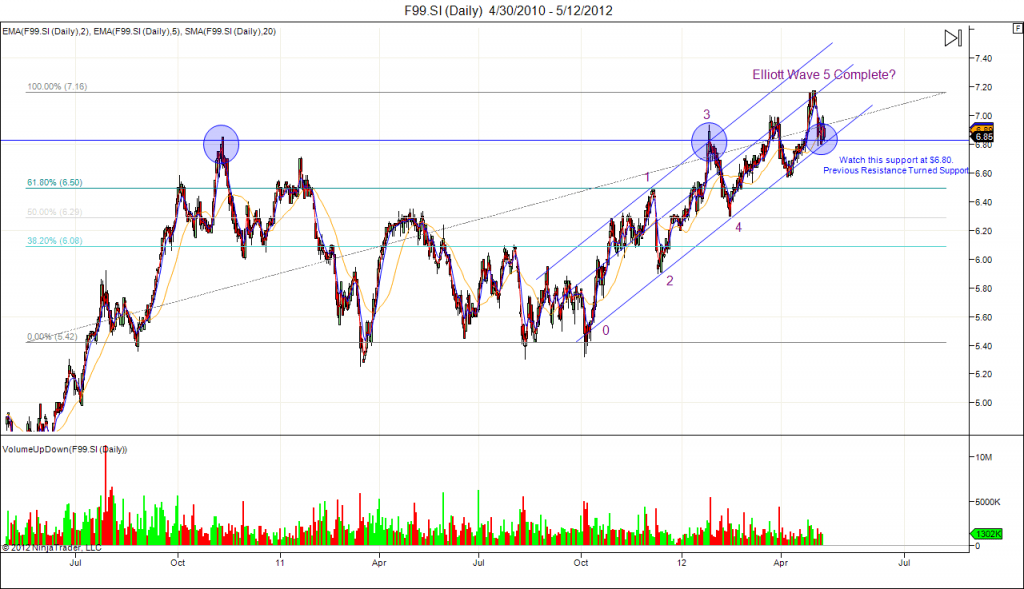
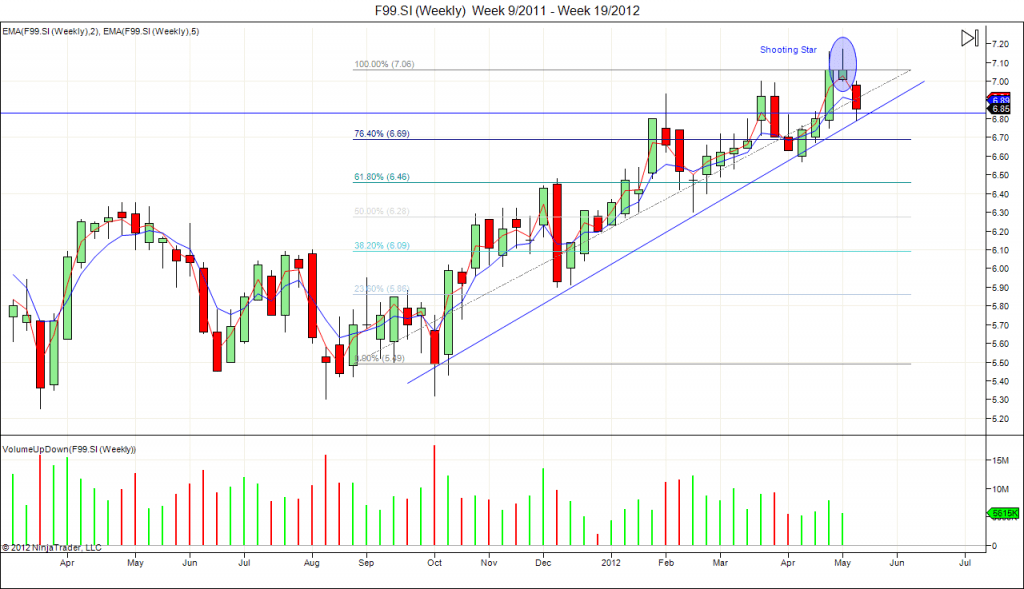
Base on current daily and weekly chart, F&N is still on uptrend. F&N is still trading above 50D and 200D SMA. However, need to watch out for a few potential reversal signals:

  • The stock seems like trading at Elliott Wave 5 now on Daily chart. If F&N completes Wave 5, a bearish corrective wave A-B-C will start.
  • $6.80 is the previous resistance level and 50D SMA. Need to see whether F&N is able to hold above this $6.80 resistance turned support level.
  • Shooting Star and Evening Star were formed at the historical high F&N stock price, these two are reversal candlestick patterns.
  • 2/5 EMA is going to show bearish crossover on both daily and weekly chart.
  • 2/5 EMA is going to cross down 20 SMA on daily chart.
  • If all the above bearish signals appear with increase in trading volume, who say there is no “Sell in May and Go Away” this year?

If the $6.80 support is strong and F&N continues the uptrend, I will still NOT enter any long position.

Reason? My rule: NEVER BUY AT HIGH!

So, I am FULL BEAR on F&N stock and preparing to short!

Continue ReadingF&N: Up Trend Still Intact But Need to be Cautious!

SembCorp Industries: Elliott Wave V starts?

  • Post author:

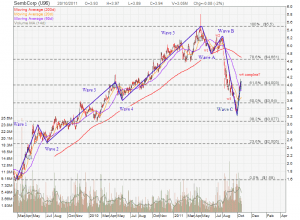
SembCorp is not able to get past the $4.00 resistance (also the 61.8% Fibonacci Retracement Level) and looks like the completion of Elliott Wave 1, 2, 3, 4, 5 & A-B-C (marked in blue color).

Reversely, it looks like another Elliott Wave (downward wave – marked in red) in formation starting wave 1 at $5.50. If this is true, wave 4 may have been completed at $4.00 and wave 5 may start now and will reach $3.077 as minimum target. For this scenario to happen, wave 5 must break the recent low at about $3.20.


See previous analysis of SembCorp Industries capped at $4.00 here.


Continue ReadingSembCorp Industries: Elliott Wave V starts?