Someone ask me whether Starhub is good for long term investing…… My answer: “Depends on your objective and your risk appetite”.
For me, Starhub is a boring stock base on a few reasons:
Fundamentally
- I will not invest in a stock which is NOT undervalue. Starhub is overvalue base on PE ratio & PEG valuation method.
- 4.4% Dividend is not attractive to me because there are other stocks with better Dividend like REIT. There is no guarantee that Starhub must pay dividend to the investor as a company, unlike REIT which governed by law that they have to pay out 90% of the net income.
- One of my investing rule is “Buy Low Sell High”. Current Starhub stock price is DEFINITELY NOT at Low. No point for me to take the risk because downside risk is much higher than upside potential.
Key Statistics for STH
| Current P/E Ratio (ttm) |
21.6436 |
| Estimated P/E(12/2013) |
21.3679 |
| Relative P/E vs. FSSTI |
1.6182 |
| Earnings Per Share (SGD) (ttm) |
0.2093 |
| Est. EPS (SGD) (12/2013) |
0.2120 |
| Est. PEG Ratio |
5.6529 |
| Market Cap (M SGD) |
7,787.37 |
| Shares Outstanding (M) |
1,719.07 |
| 30 Day Average Volume |
1,692,133 |
| Price/Book (mrq) |
178.9531 |
| Price/Sale (ttm) |
3.2117 |
| Dividend Indicated Gross Yield |
4.42% |
| Cash Dividend (SGD) |
0.0500 |
| Last Dividend |
04/17/2013 |
| 5 Year Dividend Growth |
5.05% |
| Next Earnings Announcement |
05/03/2013 |
Technically
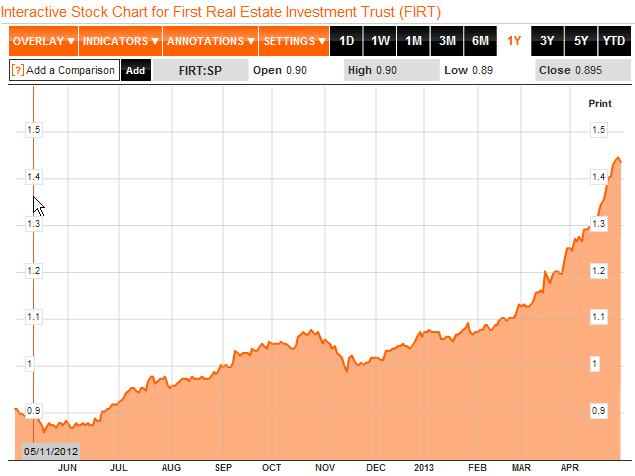
- I am a trader. I HATE to see those stock chart in one straight line. There is no clear pattern, support and resistance to plan my trade.
- Starhub is trading in a Parabolic curve without a healthy correction along the way.
- I am unable to plan my profit target, stop loss and holding time frame.

Is Starhub a boring stock? I am also interested to know from you… Feel free to leave your view here.


