Lesson Learnt from Parabolic Curve – Did you Get Burnt?
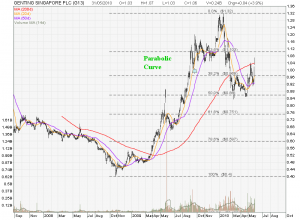
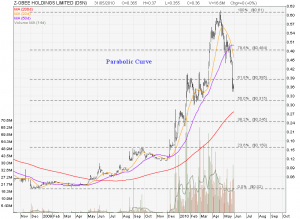
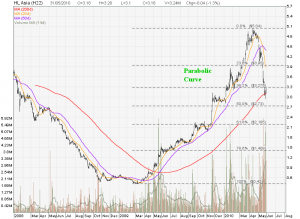
Be careful when you see any stock chart shows Parabolic Curve. The price goes up very fast and comes down even faster. I posted 3 stock stocks here from Genting Singapore, Z-Obee and HL Asia and you can see the commonalities of the chart patterns.
- Stock price climb very fast in a very short period. Chart gradient is more than 45 degree when you zoom out the chart by expanding the time frame.
- When the chart breakdown, the stock price plunges close to 50% Fibonacci Retracement Level within one or two months.
Lessons Learnt from this Parabolic Curve Chart Pattern
- You can make fast money by riding on Parabolic Curve but you must know when to get out.
- The above three charts start crossing down the 20D MA, that is the 1st signal to get out. When crossing 50D MA, that is the 2nd signal to take profit or cut loss.
- When trading stock with Parabolic Curve, must keep an very close eye on the chart pattern every day.
Feel free to leave a note here if you see any Singapore Stocks are showing Parabolic Chart Patterns.
If you are still not clear what is a Parabolic Curve is about, I have compiled this pattern in my Breakout Patterns Quick Reference Guide which is a little token of appreciation when you sponsor this website.


