Weekly Inter Market Analysis Dec 31-2016

  • Post author:

See previous week Weekly Inter Market Analysis.

Original post from https://mystocksinvesting.com


SPY (SPDR S&P500 ETF)

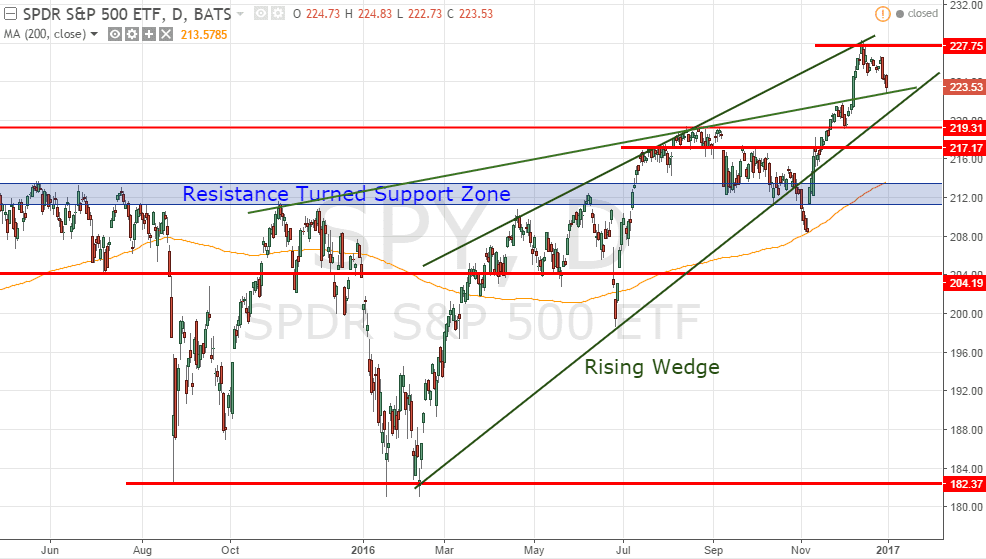
Profit taking after SPY reached the all time high of 227.75 entering into 2017.  A healthy retracement is needed for SPY to move higher. Take note that the bullish between Nov to April seasonal cycle is going to start.

  • Immediate resistance – 227.75
  • Immediate support: about 219-220. (have to turn to support for SPY to move higher)
  • Resistance turned support zone: 211-213.
  • 200D SMA support (trending up): about 213.5

spy-dec-31-2016


VIX

VIX continues to stay within the complacent zone at 14.0. No fear entering into 2017.

vix-dec-31-2016


Sector Performance (SPDR Sector ETF)

  • Best Sectors: Real Estate (XLRE) +1.38%
  • Worst Sector: Financial (XLF)  -1.44%.

sector-performance-dec31-2016


SUDX (S&P US Dollar Futures Index)

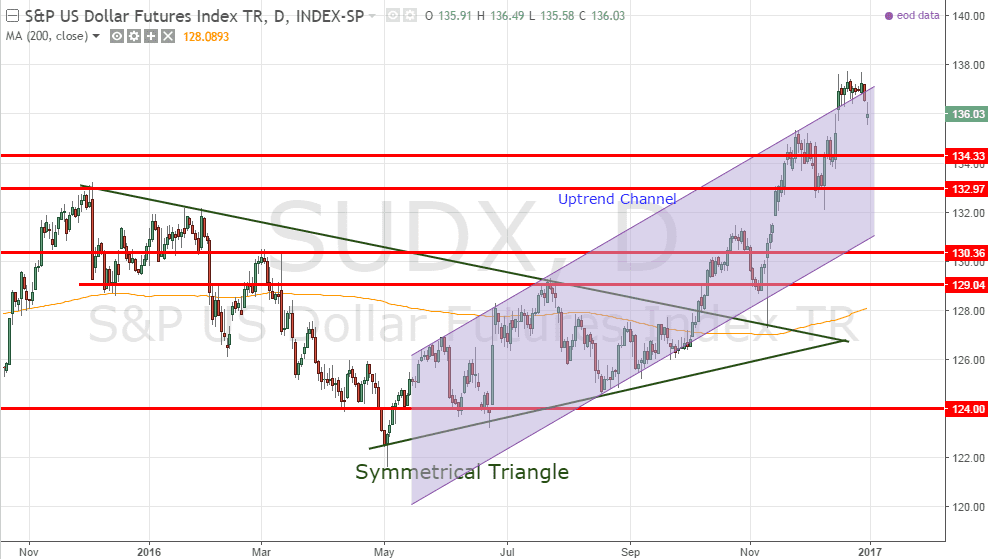
SUDX is currently facing resistance at about 138 and currently take a breather. The trend remains up for US Dollar.

sudx-dec-31-2016


FXE (Currency Shares Euro ETF)

FXE rebounded from the support at around 100.65 but is still trading within a down trend channel.  A Shooting Star candlestick is formed at the down trend channel resistance, a potential reversal in the coming weeks.

fxe-dec-31-2016


XLE (SPDR Energy Sector ETF)

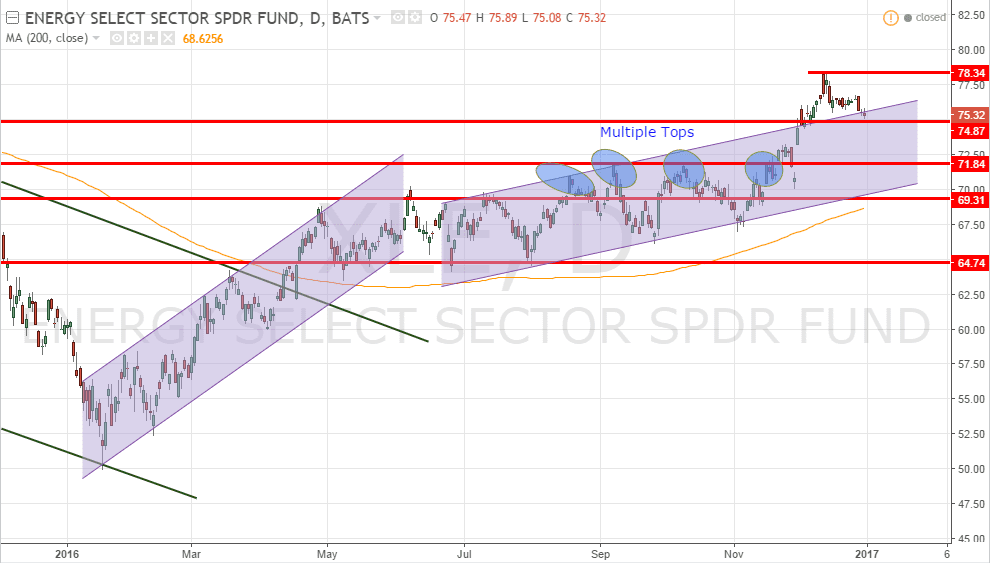
XLE is currently retracing after hitting the recent high of 78.34. If XLE can find the support at 74.87 or 71.84, the bull has strength to move XLE higher.


xle-dec-31-2016


USO (United States Oil Fund)

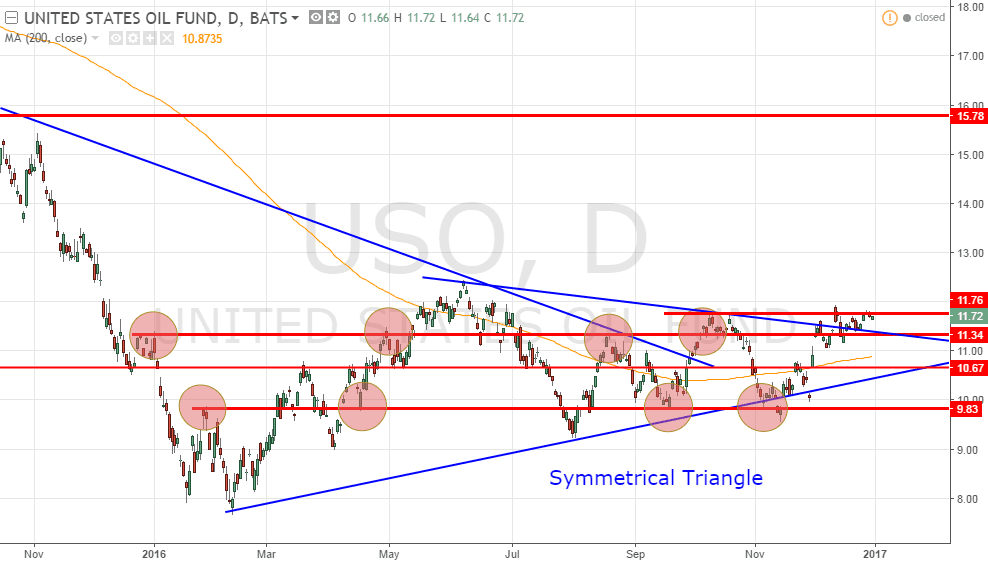
USO is currently facing the rectangle resistance zone. USO is still trading side way until a more convincing breakout.
uso-dec-31-2016

TLT (iShares 20+ Years Treasury Bond ETF)

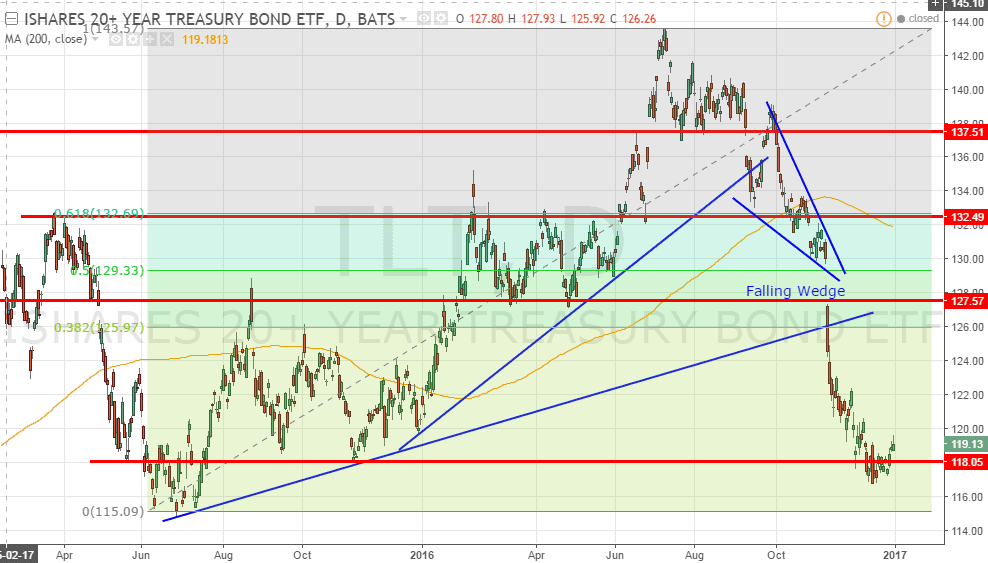
TLT is finding support at 117-118. Wait for the reversal and re-look at the bond market for bargain hunting. Some of the bonds can be very attractive after the recent sell off.

tlt-dec-31-2016


GLD (SPDR Gold Shares)

GLD is rebounding from the support at about 107 after the huge sell off. Will it rebound strongly from here entering into 2017?

gld-dec-31-2016


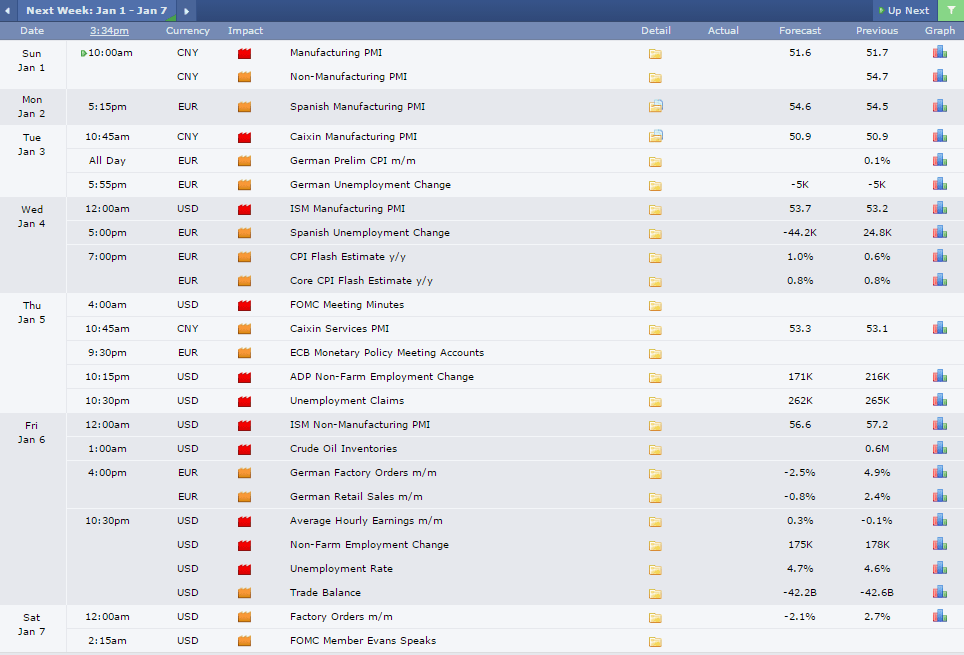
Next Week Economic Calendar

Key events:

  • China Manufacturing PMI on Jan 1 (Sunday). Take note that China Manufacturing PMI has been in expansion mode for 3 months continuously.
  • US Manufacturing PMI on Jan 4 (Wednesday).
  • FOMC Meeting Minutes on Jan 5 (Wednesday)
  • Crude Oil Inventories on Jan 6 (Friday)
  • US Unemployment Rate on Jan 6 (Friday)

economic-calendar-jan-1-2017-to-jan-7-2017

See upcoming Events here. https://mystocksinvesting.com/events/


Weekly Market Summary.


Continue ReadingWeekly Inter Market Analysis Dec 31-2016

Weekly Inter Market Analysis Oct 9-2016

  • Post author:

See previous week Weekly Inter Market Analysis.

Original post from https://mystocksinvesting.com

SPY (SPDR S&P500 ETF)

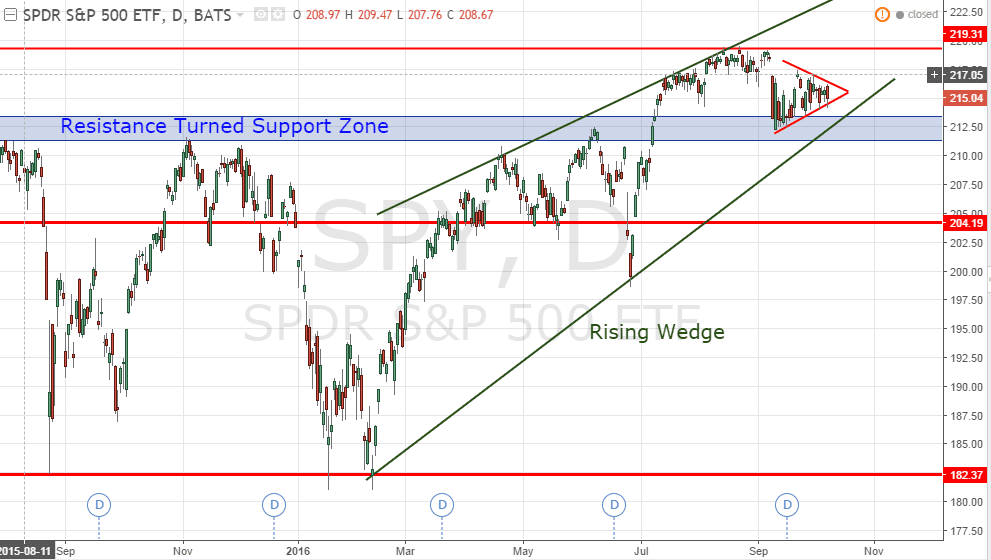
SPY is currently forming a symmetrical triangle in a big Rising Wedge pattern. Symmetrical Triangle is a consolidation pattern until breakout. Keep an eye on on key supports:

  • Resistance turned support zone: 211-213
  • Rising Wedge immediate support: about 210
  • Previous Head and Shoulders neckline support: about 204.
  • Rising Wedge next support: about 200

spy-oct9-2016


VIX

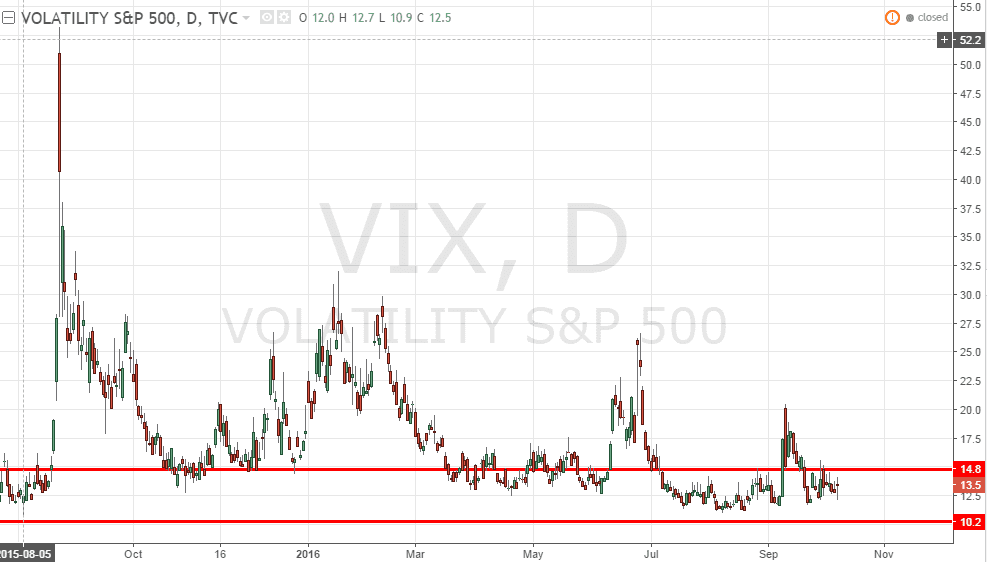
VIX still stays below 15 – a complacent zone.

vix-oct9-2016


Sector Performance (SPDR Sector ETF)

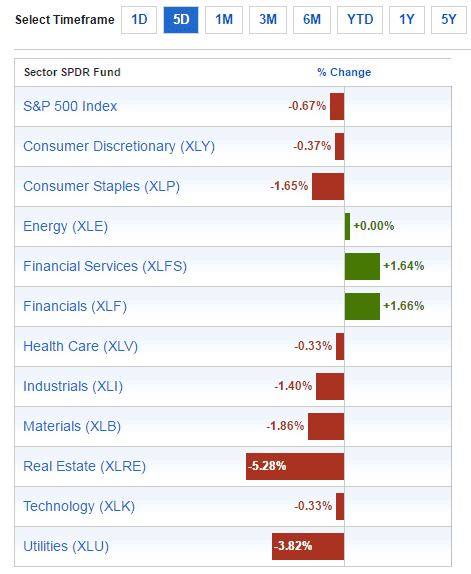
  • Best Sectors: Financials (XLF) +1.66%
  • Worst Sector: Real Estate (XLRE) – 5.28%

sector-oct9-2016


SUDX (S&P US Dollar Futures Index)

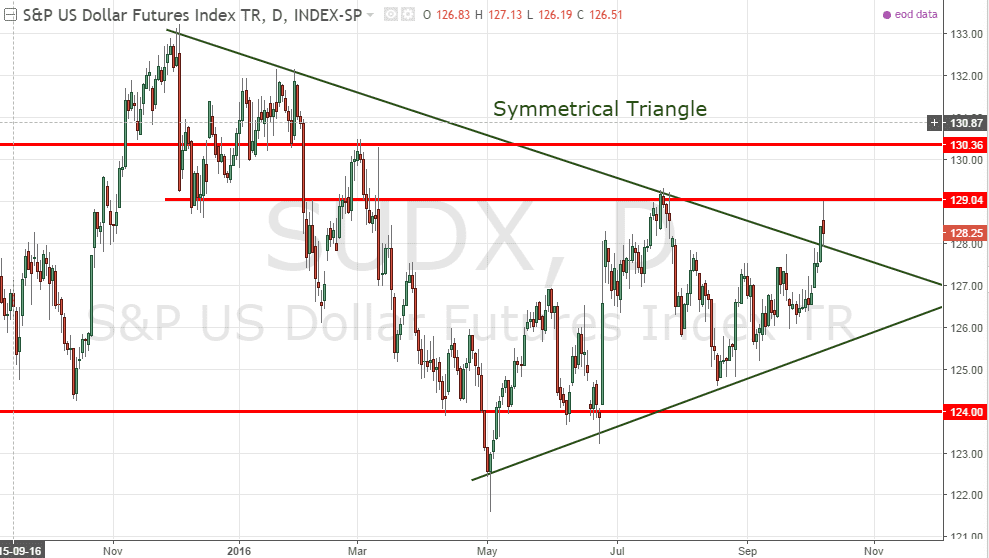
SUDX broke out from the Symmetrical Triangle but immediately rejected at the support turned resistance at about 129.04 with a shooting star. Still need to wait for the confirmation of the breakout. Next FOMC statement on Nov 1/2.

sudx-oct9-2016


FXE (Currency Shares Euro ETF)

FXE is still trading sideway and range bound. Have to wait till next FOMC statement on Nov 1/2 before we can see the next big move.

fxe-oct9-2016


XLE (SPDR Energy Sector ETF)

Uptrend channel redrawn. XLE moves above 69.31. Critical support at 64.74 which has been tested for 5 times.

xle-oct9-2016


USO (United States Oil Fund)

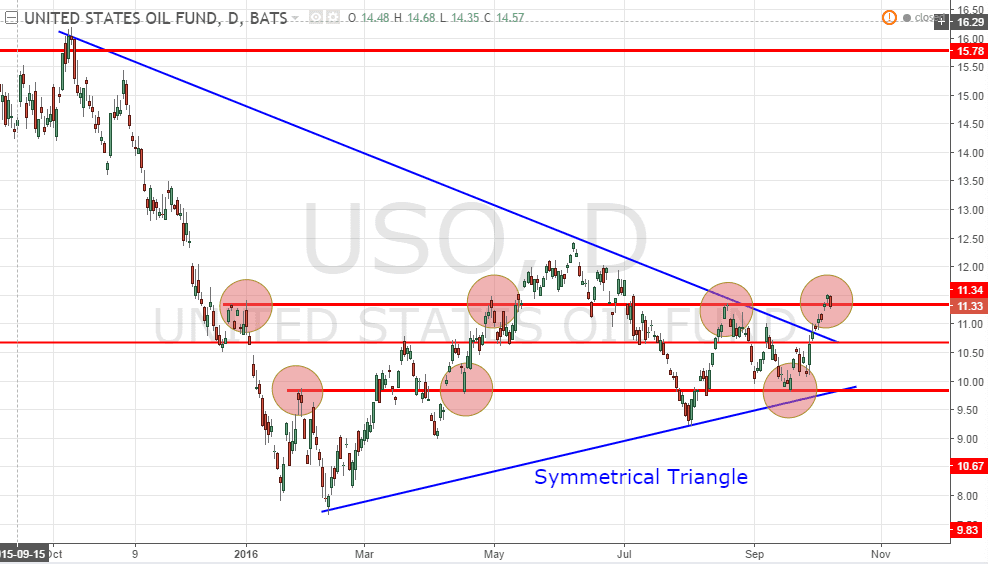
USO broke out from Symmetrical Triangle but immediately rejected at the strong resistance with a Hanging Man with confirmation. Expect bearish reversal in the coming week.

uso-oct9-2016


TLT (iShares 20+ Years Treasury Bond ETF)

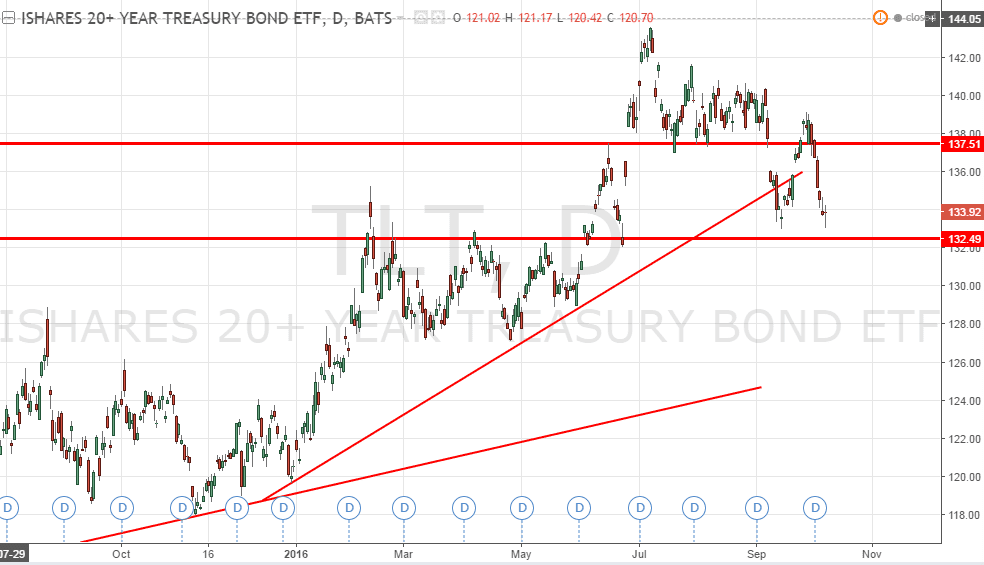
TLT broke 137.51 support and currently just resting on the next support at 132.5 with a Doji, indicates a pause in the recent down trend. Very interesting to see the sell down in TLT when SPY is moving side way.

tlt-oct9-2016


GLD (SPDR Gold Shares)

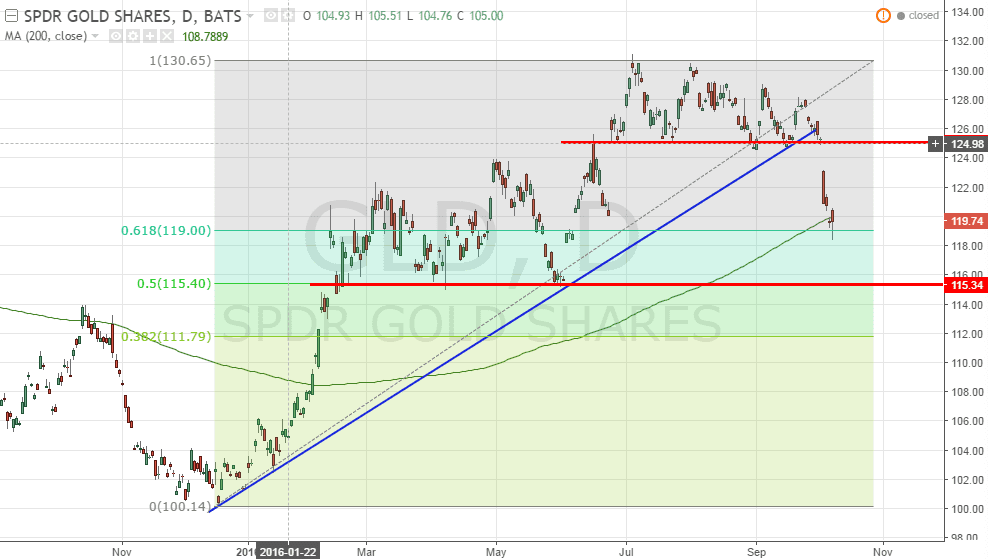
  • GLD broke down from the support with a gap down. GLD is currently testing a 200D SMA support. Can this 200D SMA support hold? Take note that 200D SMA is still trending up.
  • Fibonacci Retracement level redrawn for GLD. Currently GLD is also sitting on the 61.8% Fibonacci Retracement Support.
  • Expect GLD to rebound from level.

gld-oct9-2016


Next Week Economic Calendar

Key events:

  • FOMC Meeting Minutes on Oct 13 (Thursday)
  • Crude Oil Inventory on Oct 14 (Friday)
  • Janet Yellen speaks on Oct 15 (Saturday)

economic-calendar-oct9-oct15-2016

Continue ReadingWeekly Inter Market Analysis Oct 9-2016

Lean Hogs: Reversal Pattern to Short?

  • Post author:

Lean Hog D1 broke the uptrend support with a gap down on last trading day after showing a Shooting Star. 70 is also a strong resistance zone. Good Reward Risk Ratio to short Lean Hogs with target at 60 which is the resistance turned support level. Also take note that 60 & 70 are both psychological round number support & resistance.

If you want to learn how to short any stocks, indices, forex or commodities, check out the Short Selling Course here.

Lean Hog Feb22-2016

Continue ReadingLean Hogs: Reversal Pattern to Short?