
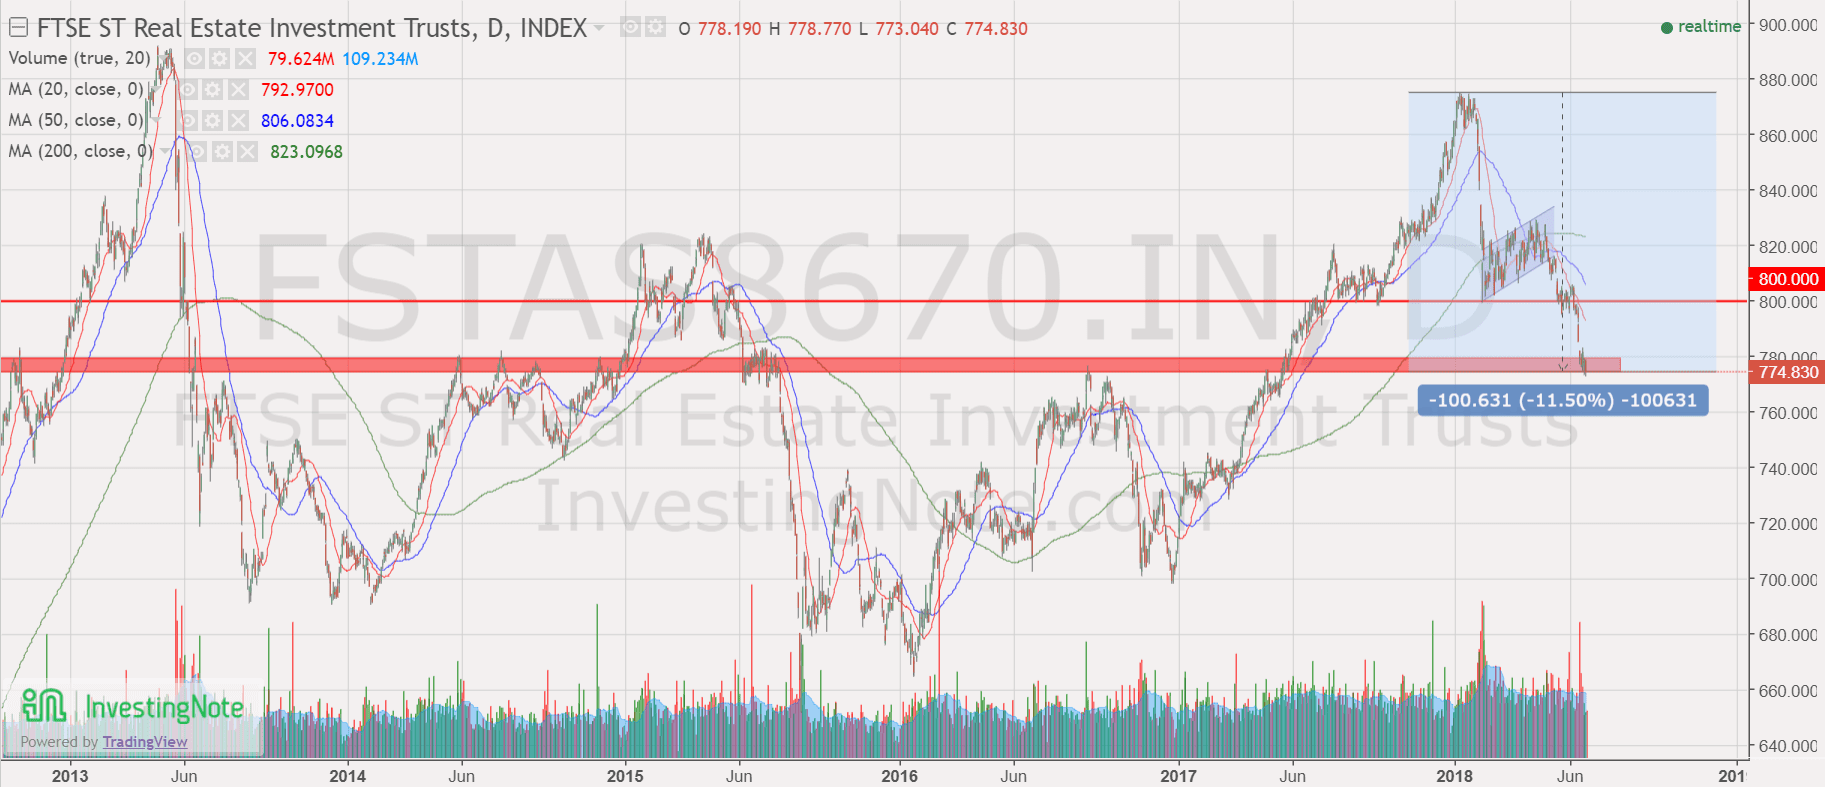
Singapore REIT Index Hit by Bear! Panic Sell or Good Time To Buy?
Singapore REIT index has dropped about 11.5% since peaking in Jan 2018. Singapore REIT Index continues the down trend but currently may be finding a temporary support at Resistance Turned Support zone. Singapore REIT sector may fall further if this support is broken. Based on valuation, there are more room to drop further for some REITs but some REITs are closed to attractive entry level.
By the way, I have given a warning since Feb 2018 in my blog post and my seminars.
See previous blog post here. https://mystocksinvesting.com/singapore-reits/singapore-reit-fundamental-analysis-comparison-table-12-feb-2018/
If you have the following questions, or do not know what to do, or need a second opinion on your plan, you may engage an unbiased 3rd party and independent REIT portfolio review (advisory fee applied). Send your inquiry to marubozu@mystocksinvesting.com
- Should I sell now and buy back later?
- Should I buy more now?
- Should I sell everything and park in cash?
- How low can REIT sector go?
- Are there better opportunities at the moment besides REITs?
- When is the good time to buy REITs again?
- Which REIT sectors should I invest in?
- How to select Fundamentally strong REITs to invest for long term?


