Weekly Inter Market Analysis Dec 31-2016

  • Post author:

See previous week Weekly Inter Market Analysis.

Original post from https://mystocksinvesting.com


SPY (SPDR S&P500 ETF)

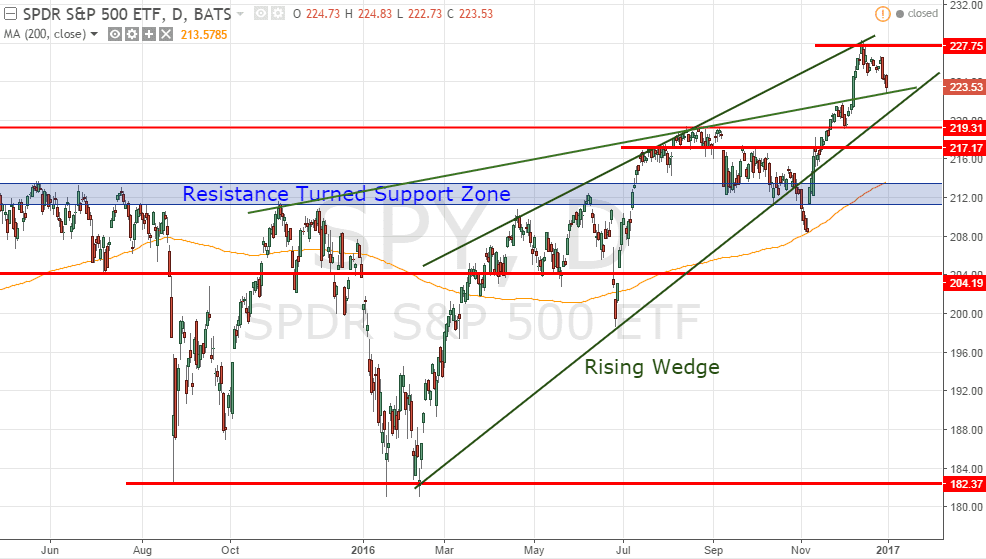
Profit taking after SPY reached the all time high of 227.75 entering into 2017.  A healthy retracement is needed for SPY to move higher. Take note that the bullish between Nov to April seasonal cycle is going to start.

  • Immediate resistance – 227.75
  • Immediate support: about 219-220. (have to turn to support for SPY to move higher)
  • Resistance turned support zone: 211-213.
  • 200D SMA support (trending up): about 213.5

spy-dec-31-2016


VIX

VIX continues to stay within the complacent zone at 14.0. No fear entering into 2017.

vix-dec-31-2016


Sector Performance (SPDR Sector ETF)

  • Best Sectors: Real Estate (XLRE) +1.38%
  • Worst Sector: Financial (XLF)  -1.44%.

sector-performance-dec31-2016


SUDX (S&P US Dollar Futures Index)

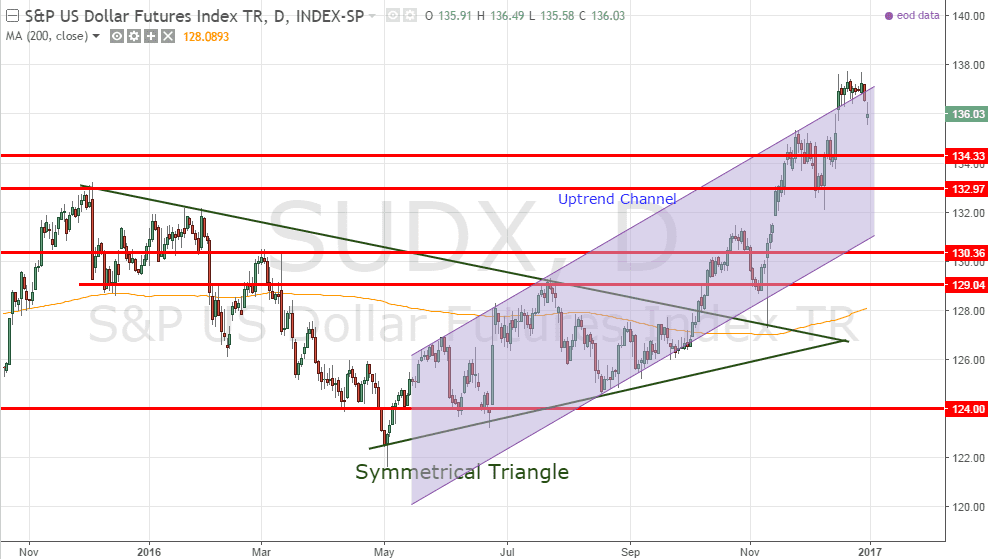
SUDX is currently facing resistance at about 138 and currently take a breather. The trend remains up for US Dollar.

sudx-dec-31-2016


FXE (Currency Shares Euro ETF)

FXE rebounded from the support at around 100.65 but is still trading within a down trend channel.  A Shooting Star candlestick is formed at the down trend channel resistance, a potential reversal in the coming weeks.

fxe-dec-31-2016


XLE (SPDR Energy Sector ETF)

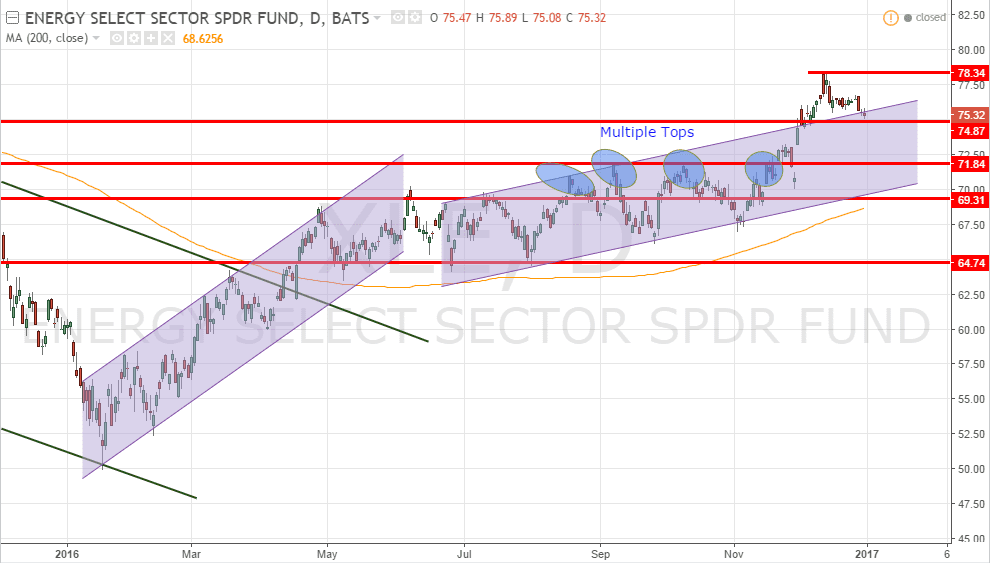
XLE is currently retracing after hitting the recent high of 78.34. If XLE can find the support at 74.87 or 71.84, the bull has strength to move XLE higher.


xle-dec-31-2016


USO (United States Oil Fund)

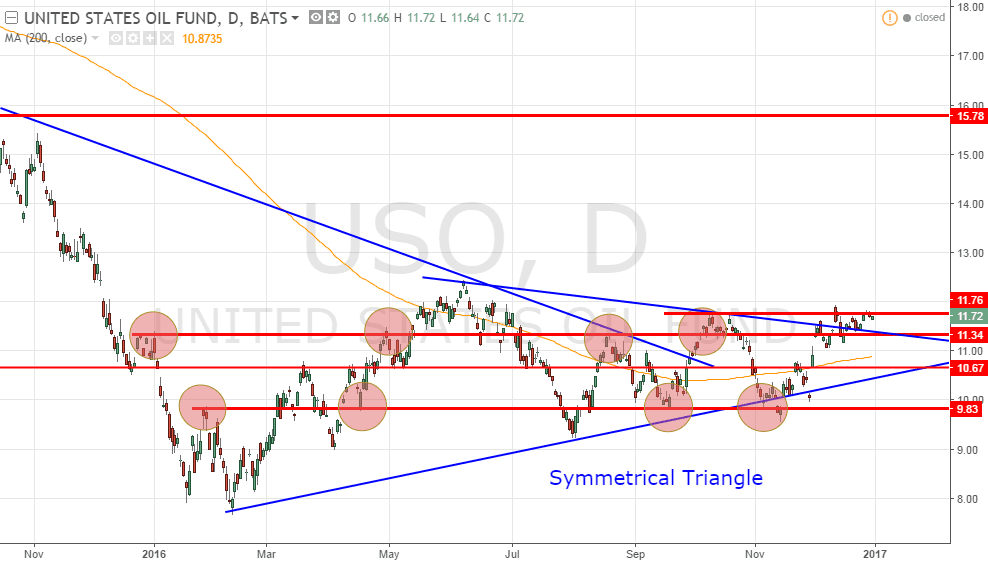
USO is currently facing the rectangle resistance zone. USO is still trading side way until a more convincing breakout.
uso-dec-31-2016

TLT (iShares 20+ Years Treasury Bond ETF)

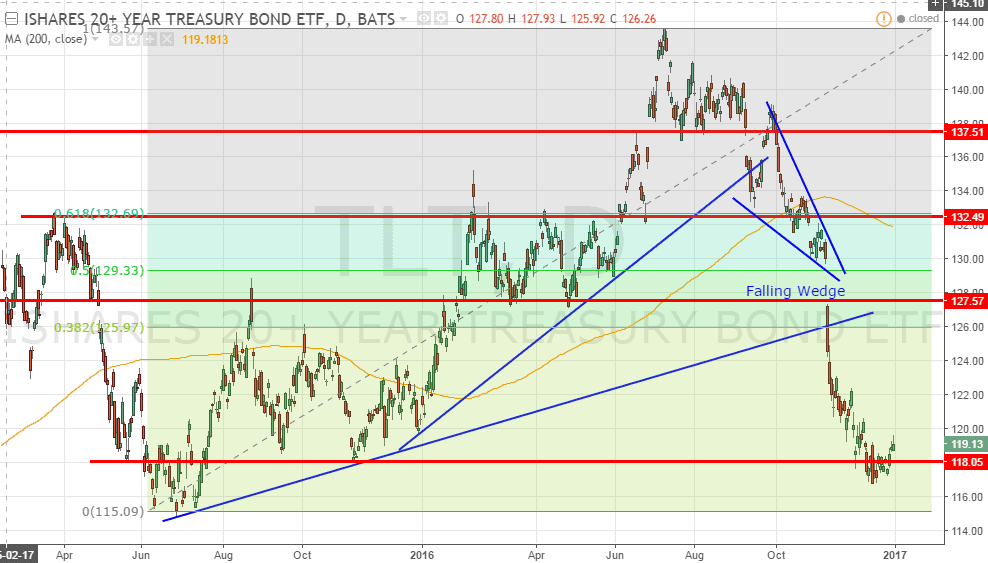
TLT is finding support at 117-118. Wait for the reversal and re-look at the bond market for bargain hunting. Some of the bonds can be very attractive after the recent sell off.

tlt-dec-31-2016


GLD (SPDR Gold Shares)

GLD is rebounding from the support at about 107 after the huge sell off. Will it rebound strongly from here entering into 2017?

gld-dec-31-2016


Next Week Economic Calendar

Key events:

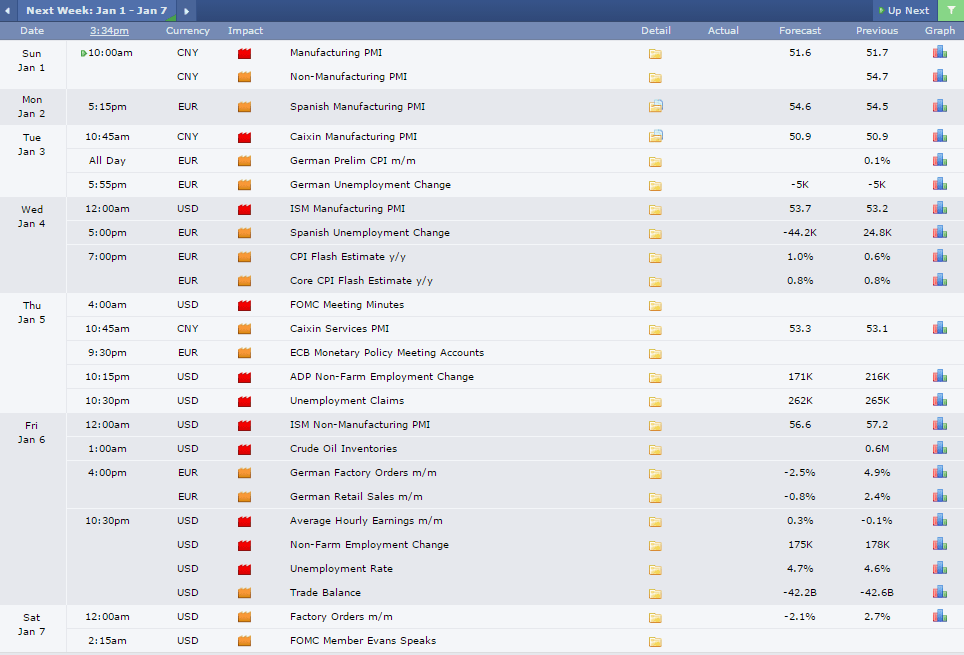
  • China Manufacturing PMI on Jan 1 (Sunday). Take note that China Manufacturing PMI has been in expansion mode for 3 months continuously.
  • US Manufacturing PMI on Jan 4 (Wednesday).
  • FOMC Meeting Minutes on Jan 5 (Wednesday)
  • Crude Oil Inventories on Jan 6 (Friday)
  • US Unemployment Rate on Jan 6 (Friday)

economic-calendar-jan-1-2017-to-jan-7-2017

See upcoming Events here. https://mystocksinvesting.com/events/


Weekly Market Summary.


Continue ReadingWeekly Inter Market Analysis Dec 31-2016

Moving into 2017 after the Federal Reserve Rate Hike

  • Post author:

Marcus TJ

Federal Reserve Rate Hike 

The Federal Reserve recently announced that they were hiking up the price of target federal funds by a quarter of a point from 0.5% to 0.75% in a move that had been long expected by financial analysts. This is only the second time that the Federal Reserve have increased rates in a decade, doing so last December, as they look to put rates in line with the strengthening U.S. economy.

Plans have also been drawn up by the Federal Open Market Committee and its chair Janet Yellen for three more price hikes in the next year and 2/3 more in 2018 as they look to arrive at a 3% rate. Let’s look at the details of the rise and the affect which it might have.


The Decision

The decision to raise interest rates has been made after a series of meetings with the committee, this is the 3rd time that Yellen has tabled the idea of a rate hike since the initial rate increase in December 2015. In the past, the decision has not been unanimous as many felt that the economy wasn’t improving at the necessary rate. Following the last meeting however, all agreed that the interest rate could be increased to match inflation levels.


Good News or Bad News

On the face of it, a rising rate could appear like bad news for many but it is in fact a strong sign of a growing economy. It is important to remember that interest levels were at around 5% in 2006 and during the 80s it was as high as 10%. In that sense 0.75% doesn’t look so bad.


How the Market Reacted

As this wasn’t an unexpected move, the market didn’t spiral out of control when the decision was announced, there were some loses felt, but nothing too hard to recover from. The Dow Jones index closed at around 120 points down with Caterpillar Inc. being the biggest decliner, Nasdaq fell by almost 0.5% and the S&P 500 fell 14.6 points as the energy sector lead the fall with an average 2% drop. This was nothing out of the ordinary for the markets as any decision from the Federal Reserve to change prices will see an uncertain reaction from the market.


What Global Impacts Will This Have?

When the U.S. makes such a decision its impact is always felt throughout the world and the decision to raise rates was no different. To begin with, higher rates have meant that debt repayments on American loans will be higher as they are given out in dollar denominations. Exports from Asia and the EU to the United States will also become cheaper and the rising dollar will likely cause a buzz on the forex markets. It is also likely that investment capital will move away from Asia as many utilize the higher interest rates on the Atlantic to push for better returns.

This is just the second of many price hikes that the U.S. will see in the coming years and whilst it does tell of a stronger U.S. economy, it will be interesting to see how the markets reacts in the coming weeks and months.

Continue ReadingMoving into 2017 after the Federal Reserve Rate Hike

Global Stock Market Indices PE Ratio At a Glance (26 Dec 2016)

  • Post author:
  • US: Dow Jones Industrial, S&P500, NASDAQ, Russell 2000
  • Europe: FTSE100, CAC40, DAX
  • Asia: KLCI, STI, HangSeng, ASX200, CSI 300, JCI, SET, KOSPI, NIKKEI 225, SENSEX, TWSE, NZX50, PSEi
  • Best Performer: Japan Nikkei 225 up for 8.13% with PE Ratio of 23.36.
  • Worst Perfomer: Philippines PSEi down for -7.13% with PE Ratio of 19.13
  • Singapore STI has the PE ratio of 11.99 compare to the rest of the world in the following table.
  • Russia MICEX has the lowest PE ratio of 9.98 in the tracking table.
  • Added Emerging Market Stock Market Indices: Mexico MEX IPC, Brazil IBX, Argentina MAR, Russia MICEX.
  • It is obvious to see the stock market rallied in DM (Developed Market) and sold off in EM (Emerging Market) for past 1 month after Donald Trump won the US Presidential Election.


  •  PE  = Price Per Earning

See Nov-2016 Global Stock Market PE Ratio here.

stock-market-key-indices-pe-ratio-dec26-2016shiller-pe-ratio-dec26-2016

Original post from https://mystocksinvesting.com

See other event here. https://mystocksinvesting.com/events/
Continue ReadingGlobal Stock Market Indices PE Ratio At a Glance (26 Dec 2016)