
- US: Dow Jones Industrial, S&P500, NASDAQ, Russell 2000
- Europe: FTSE100, CAC40, DAX
- Asia: KLCI, STI, HangSeng, ASX200, CSI 300, JCI, SET, KOSPI, NIKKEI 225, SENSEX, TWSE, NZX50, PSEi
- Best Performer: Japan Nikkei 225 up for 4.56% with PE Ratio of 23.36.
- Singapore STI has the PE ratio of 11.99 compare to the rest of the world in the following table.
- Russia MICES has the lowest PE ratio of 8.28 in the tracking table.
- Added Emerging Market Stock Market Indices: Mexico MEX IPC, Brazil IBX, Argentina MAR, Russia MICEX.
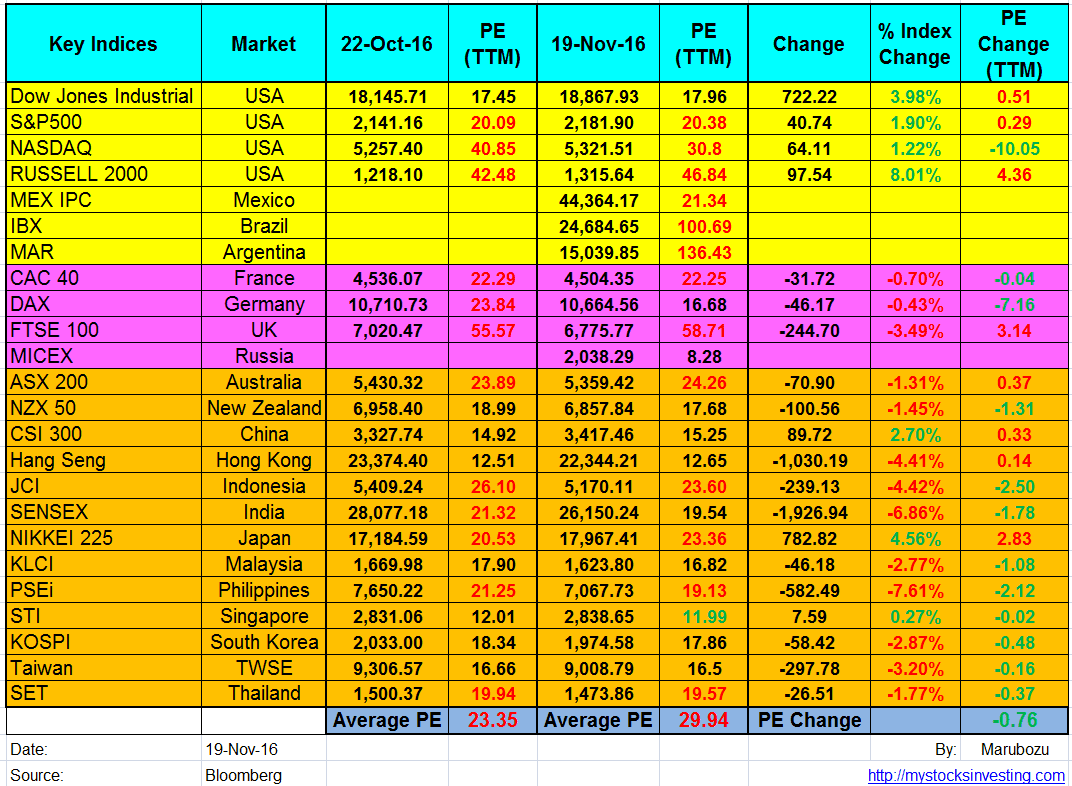
- PE = Price Per Earning
See Oct-2016 Global Stock Market PE Ratio here.
Original post from https://mystocksinvesting.com
See other event here. https://mystocksinvesting.com/events/