Weekly Inter Market Analysis Nov 27-2016
See previous week Weekly Inter Market Analysis.
Original post from https://mystocksinvesting.com
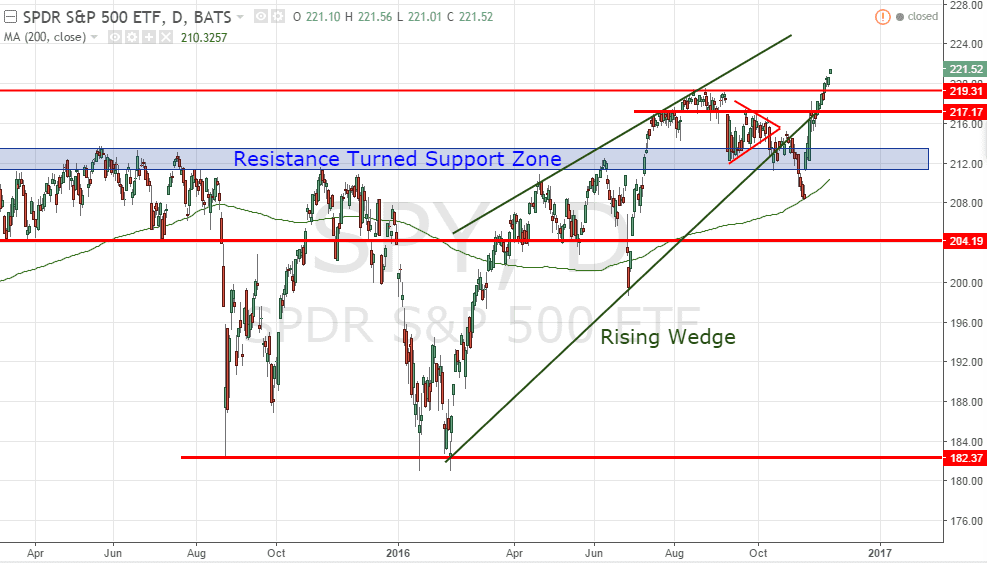
SPY (SPDR S&P500 ETF)
SPY broke the all time high resistance at 219.31 and entered into uncharted territory. Take note that the bullish between Nov to April seasonal cycle is going to start.
- Immediate resistance – None
- Historical high resistance: about 219-220. (have to turn to support for SPY to move higher)
- Resistance turned support zone: 211-213.
- Rising Wedge immediate support: about 210.
- 200D SMA support (trending up): about 210
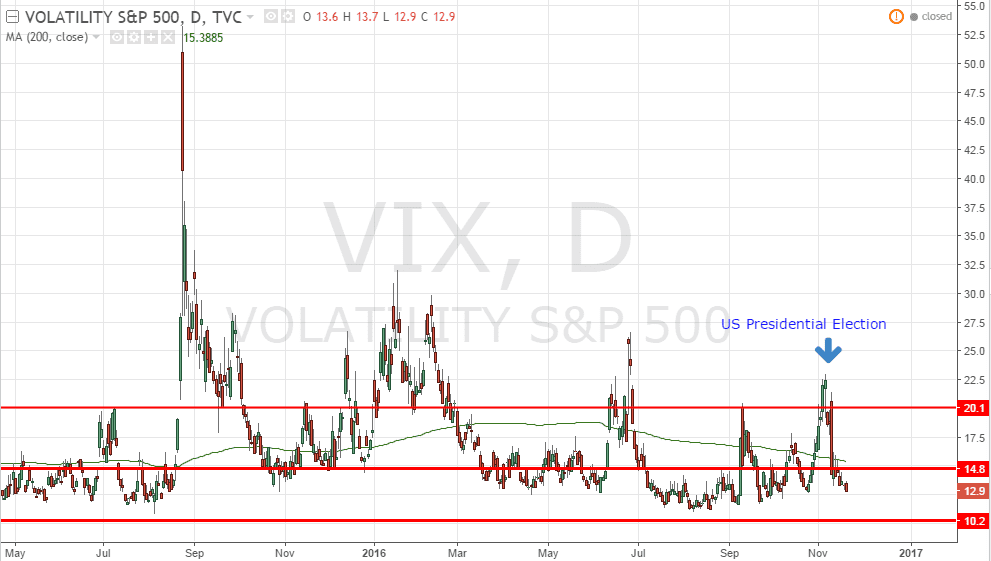
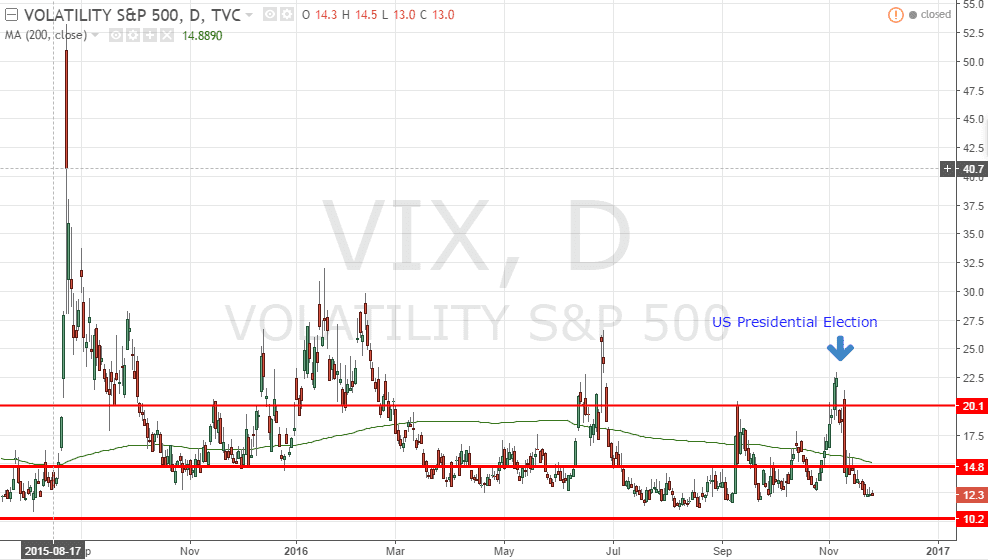
VIX
VIX dropped back to complacent zone. No fear when Santa Claus is coming to town.
Sector Performance (SPDR Sector ETF)
- Best Sectors: Material (XLB) +2.57% & Industrial (XLI) +2.30% respectively
- Worst Sector: Healthcare (XLV) -0.32%.
- Comment: It was a very bullish week with almost all the sectors gain more than 1% except Health Care.

SUDX (S&P US Dollar Futures Index)
SUDX broke out from the Mar high resistance at about 134.45 with a shooting star candlestick pattern. SUDX has moved too high too fast and definitely need a pause or retrace before moving higher.

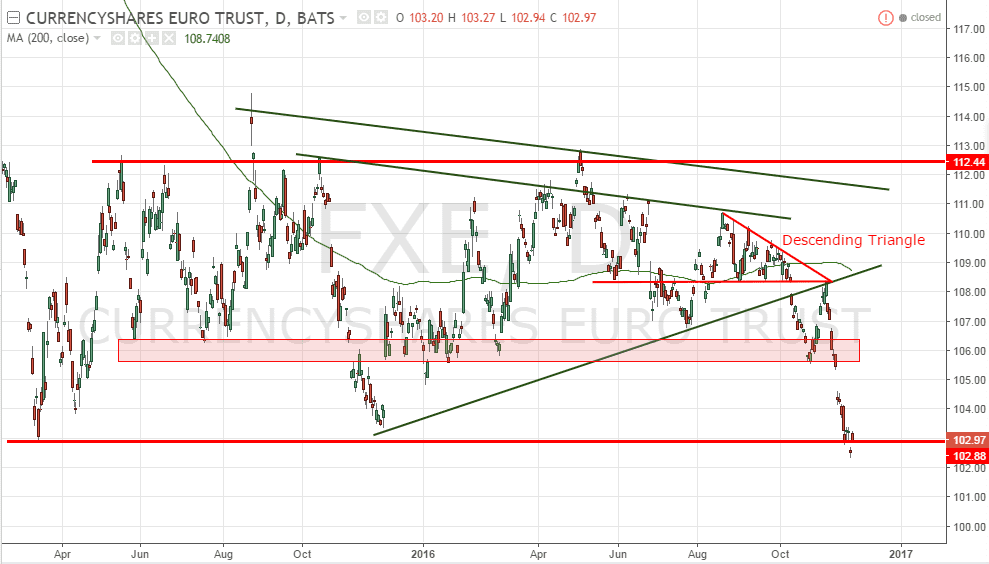
FXE (Currency Shares Euro ETF)
FXE is currently testing another critical support at about 102.94.
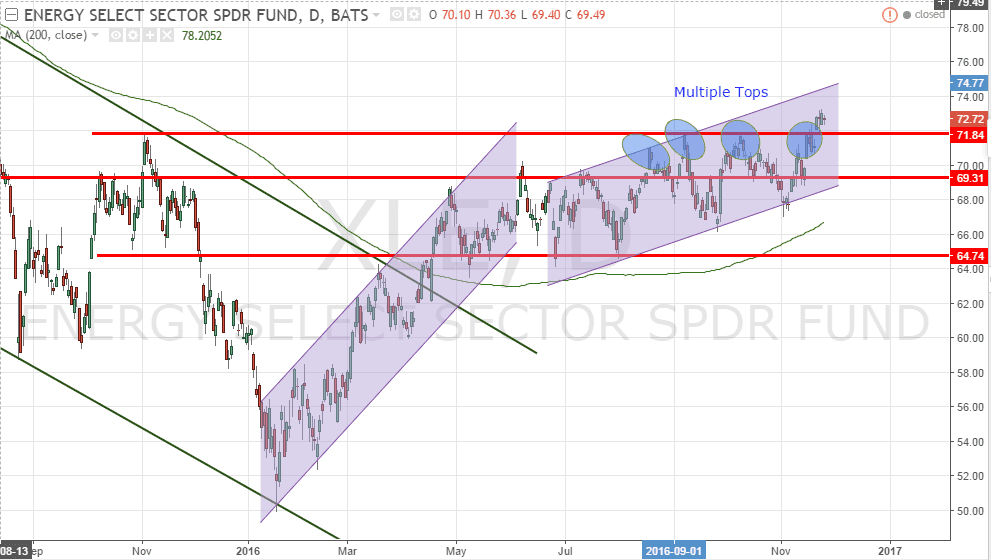
XLE (SPDR Energy Sector ETF)
XLE broke the recent multiple tops resistance and continue to trade within the up trend channel. Watch for bull run for XLE. Current chart pattern shows energy sector has bottomed up and reversed to up trend.
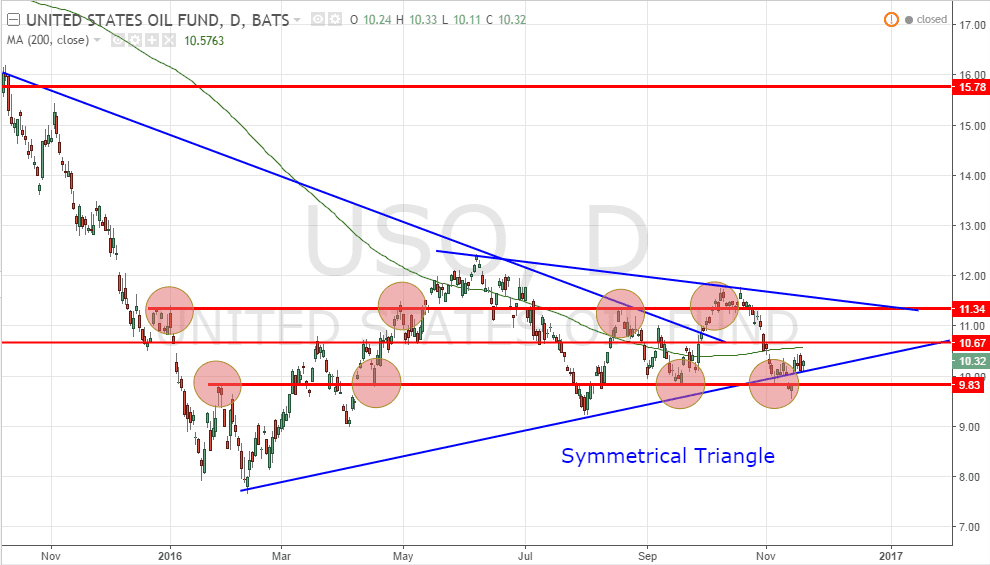
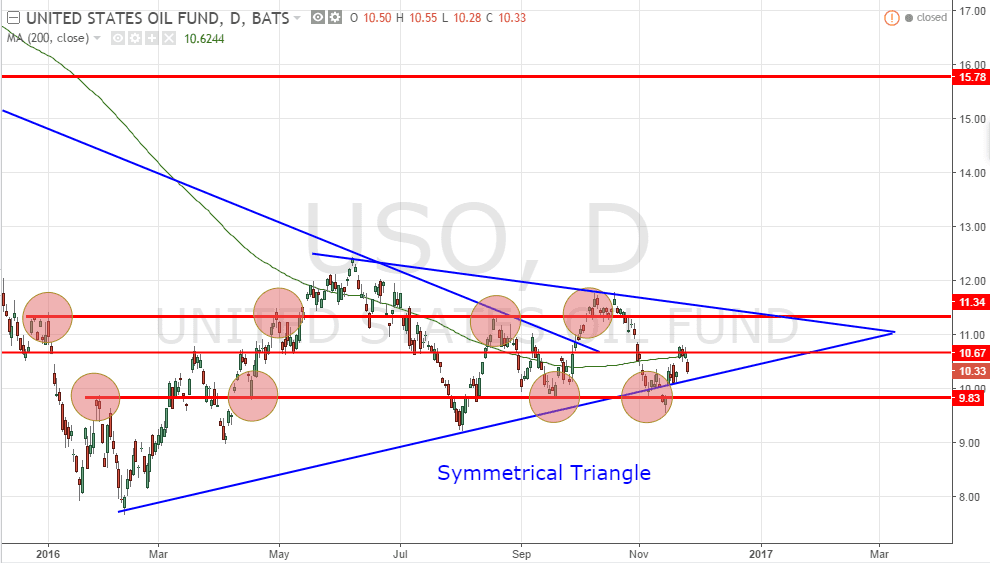
USO (United States Oil Fund)
USO is currently trading within range between 11.34 and 9.83 until breakout to either direction.
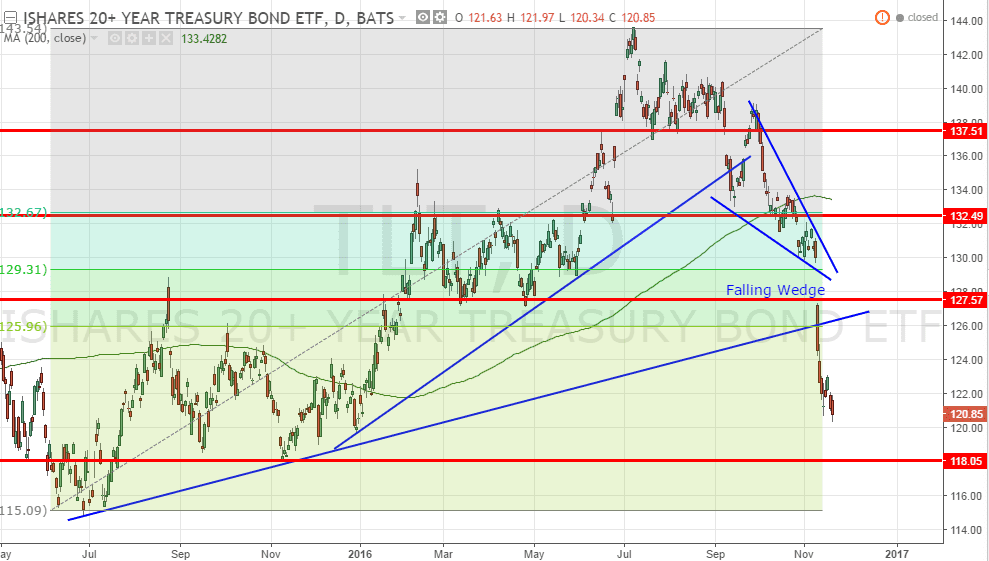
TLT (iShares 20+ Years Treasury Bond ETF)
TLT is getting near to the 118 support but the chart has not shown the sell off has stopped. Wait for the reversal and re-look at the bond market for bargain hunting. Some of the bonds can be very attractive after the recent sell off.

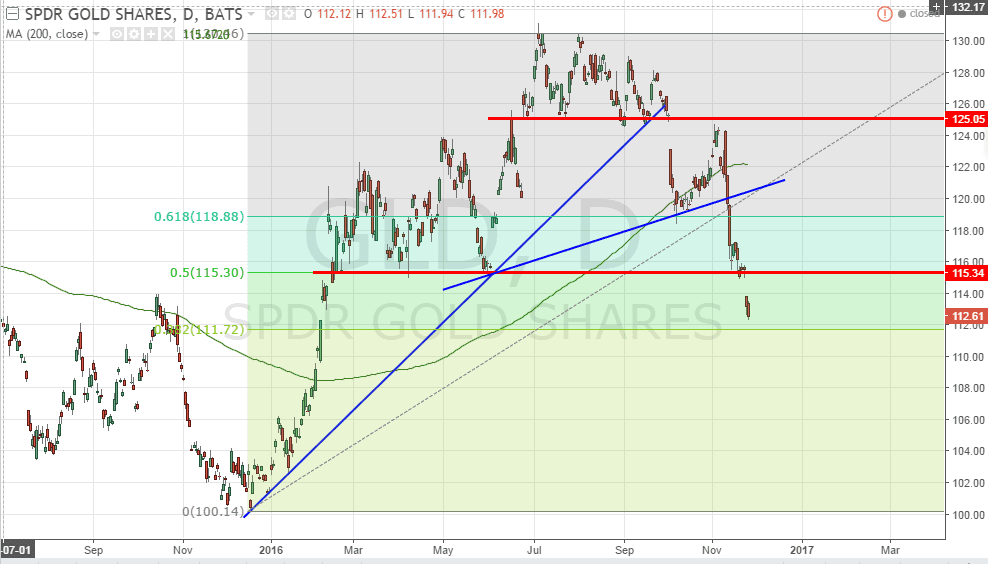
GLD (SPDR Gold Shares)
GLD broke the 115 support and continues its down trend. Next support at about 112.
Next Week Economic Calendar
Key events:
- ECB President Draghi speaks on Nov 28 (Monday) and Nov 20 (Wednesday)
- OPEC Meetings Nov 30 (Wednesday)
- Crude Oil Inventory on Dec 1 (Thursday)
- China Manufacturing PMI on Dec 1 (Thursday)
- US Unemployment rate on Dec 2 (Friday)
- ISM Manufacturing PMI on Dec 2 (Friday)

See upcoming Events here. https://mystocksinvesting.com/events/