See previous week Weekly Inter Market Analysis.
Original post from https://mystocksinvesting.com
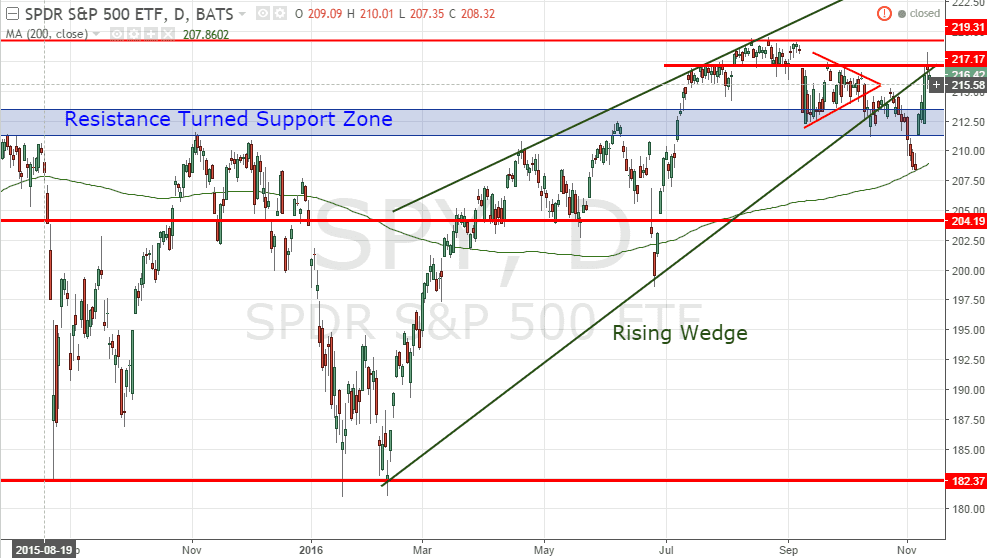
SPY (SPDR S&P500 ETF)
SPY rebounded from the 200D SMA support strongly after Donald Trump won the US Presidential Election. The strong caught everyone by surprise! SPY is technically bullish but currently facing the resistance at 217.
- Resistance turned support zone: 211-213.
- Rising Wedge immediate support: about 210.
- 200D SMA support: about 209
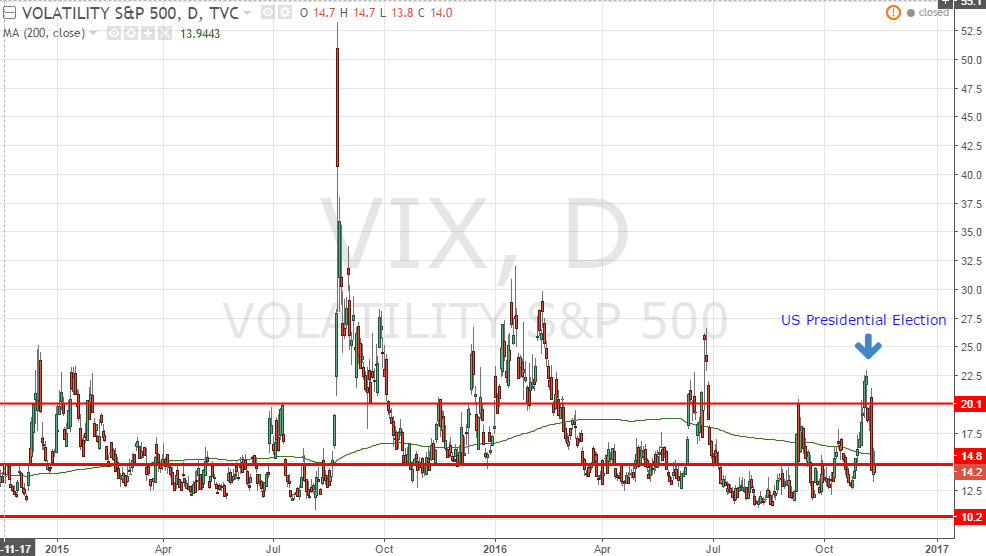
VIX
VIX spiked to 22.5 but immediately falled below 15 after Donald Trump is elected as US President.
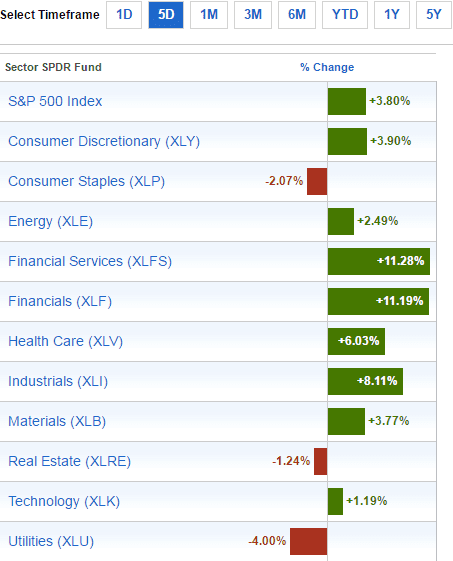
Sector Performance (SPDR Sector ETF)
- Best Sectors: Financial (XLF & XLFS) > 11% respectively, followed by Industrial (XLI) +8.11%
- Worst Sector: Utilities (XLU) -4.00% and Consumer Staples (XLP) -2.07%
- Comment: This is RISK ON combination of aggressive sectors like Financial & Industrial show bullishness but defensive sectors like Utilities and Consumer Staples are lagging.
SUDX (S&P US Dollar Futures Index)
SUDX is currently rebounded from the support around 127-128 and currently trading in an uptrend channel. US Dollar Index is on uptrend mode.

FXE (Currency Shares Euro ETF)
FXE sold off after reaching the previous wedge support turned resistance. Currently FXE is testing an important support zone. Watch for rebound else sell off continues.

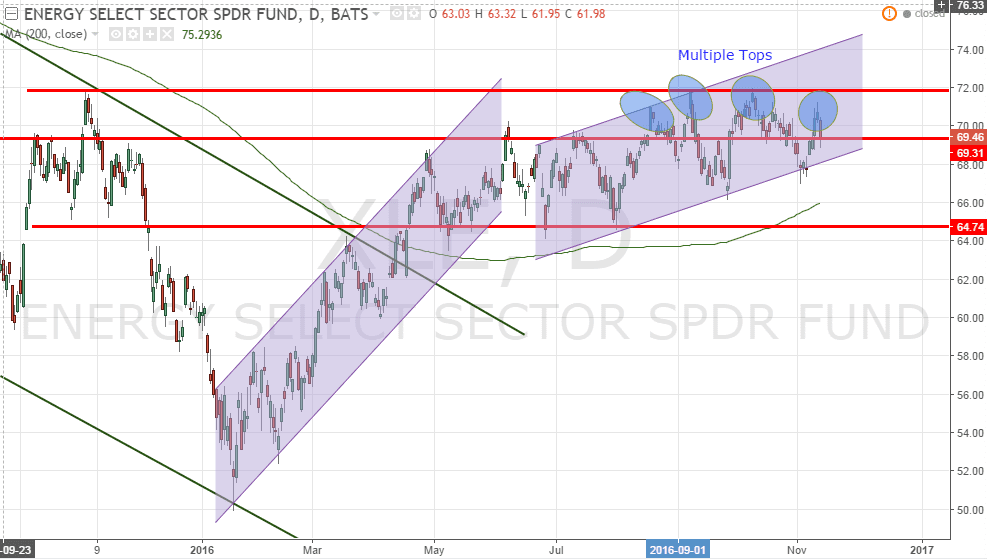
XLE (SPDR Energy Sector ETF)
Although XLE is still trading within the up trend channel, XLE is forming a multiple tops. Keep an eye on the current channel support and 200D SMA support. Breaking these supports will turn XLE into bearish mode.
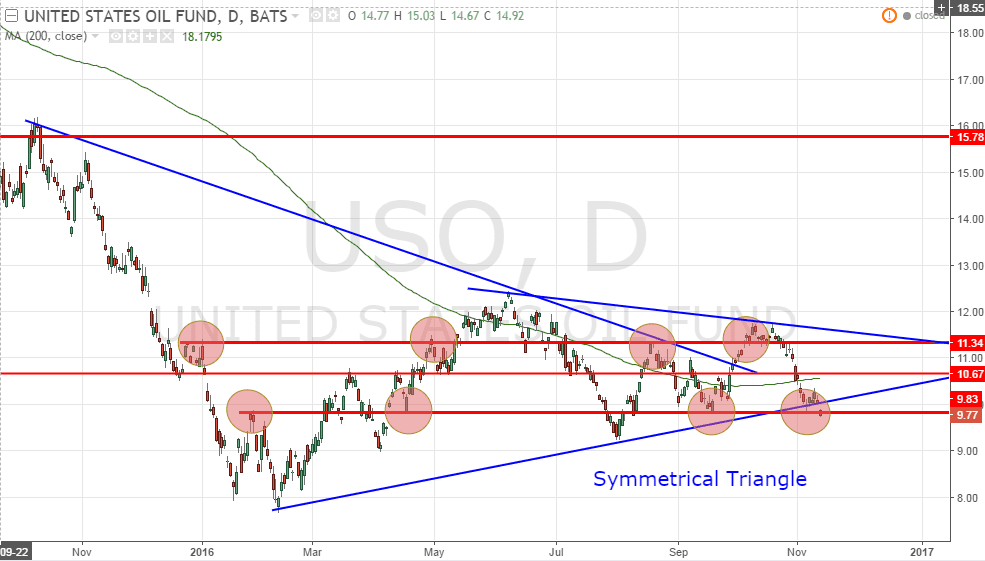
USO (United States Oil Fund)
USO is still testing the critical horizontal support and also the symmetrical triangle support. Wait for bullish candle for reversal confirmation rebound from this support level. The next support is at $9.00 if the current support is broken.
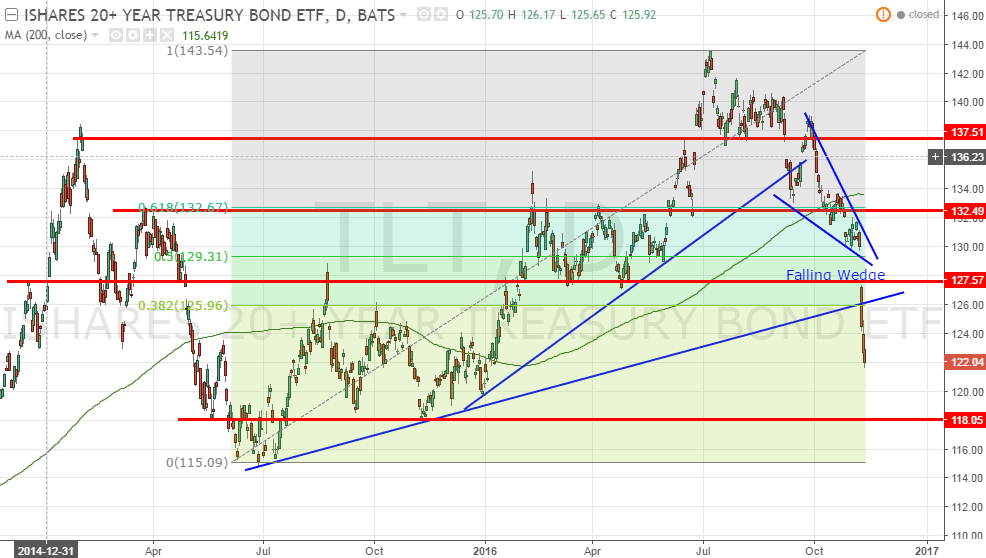
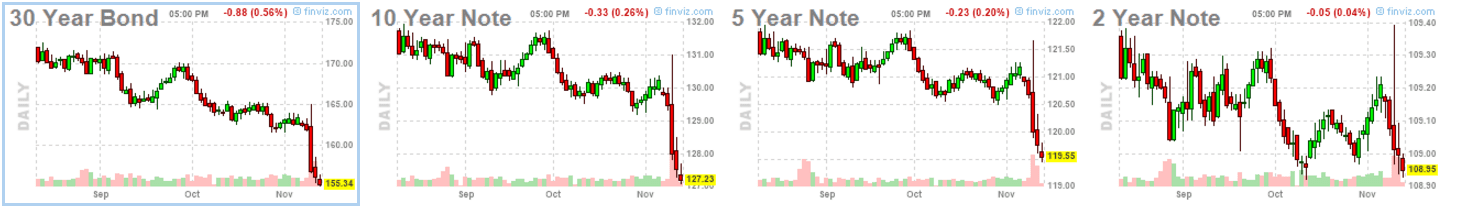
TLT (iShares 20+ Years Treasury Bond ETF)
TLT broke down from a Falling Wedge. Huge sell off in Treasury Bond continues.
Read what is happening here:
Now Equity and Bond is the “normal” inversion relationship again. Equity rallies, bond sells off –> This is a RISK ON scenario.
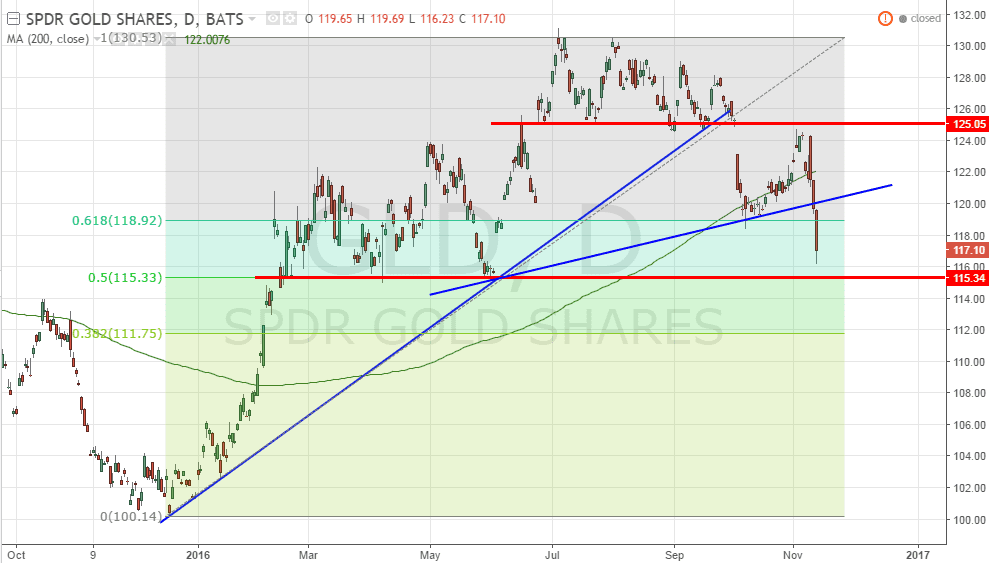
GLD (SPDR Gold Shares)
GLD broke the support at 120 and heading towards the next critical support at 115 (50% Fibonacci Retracement Level). GLD is technically bearish and trading below 200D SMA. Watch the turning sign of 200D SMA slop.
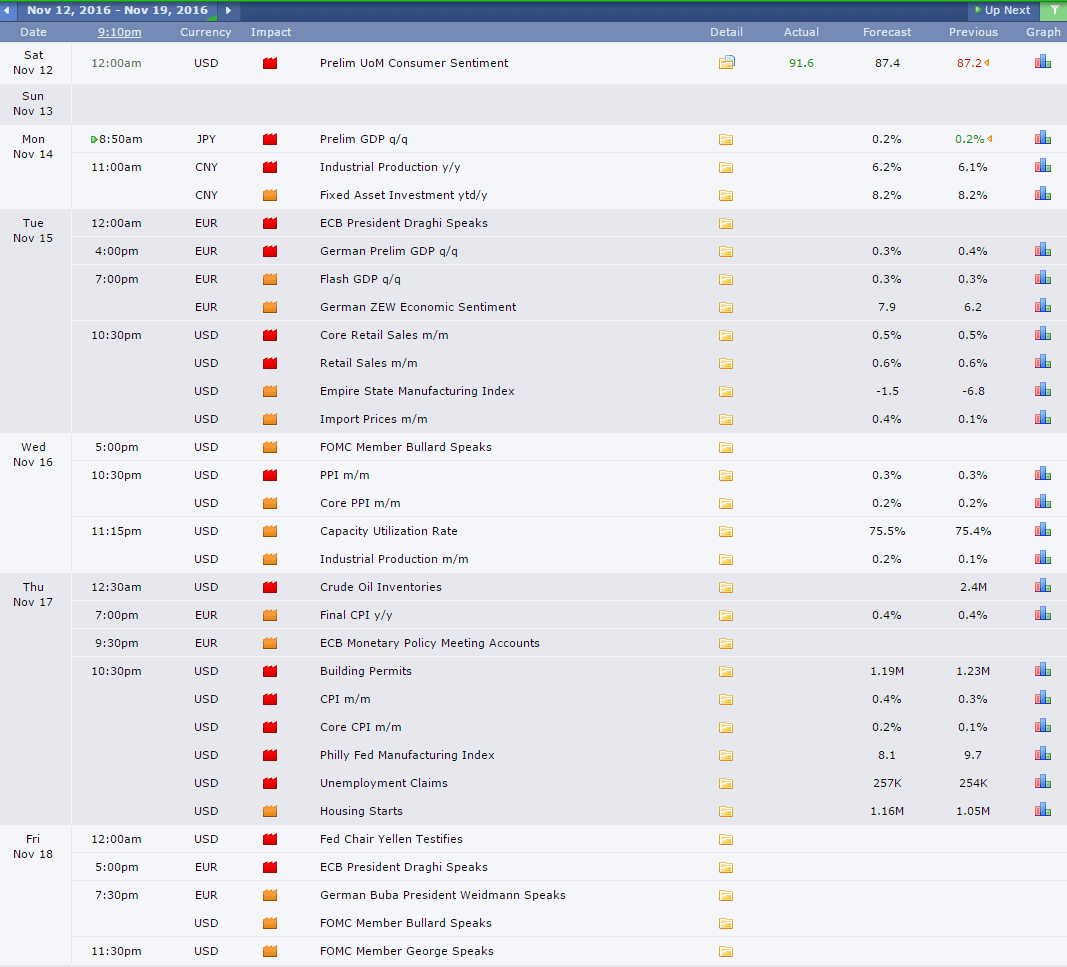
Next Week Economic Calendar
Key events:
- ECB President Draghi speaks on Nov 15 (Tuesday)
- Crude Oil Inventory on Nov 17 (Thursday)
- US Unemployment Claim on Nov 17 (Thursday)
- Fed Chair Yellen Testifies on Nov 18 (Friday)
- ECB President Draghi speaks on Nov 18 (Friday)
See upcoming Events here. https://mystocksinvesting.com/events/