
Singapore REIT Fundamental Analysis Comparison Table – 16 December 2019
Technical Analysis of FTSE ST REIT Index (FSTAS8670)
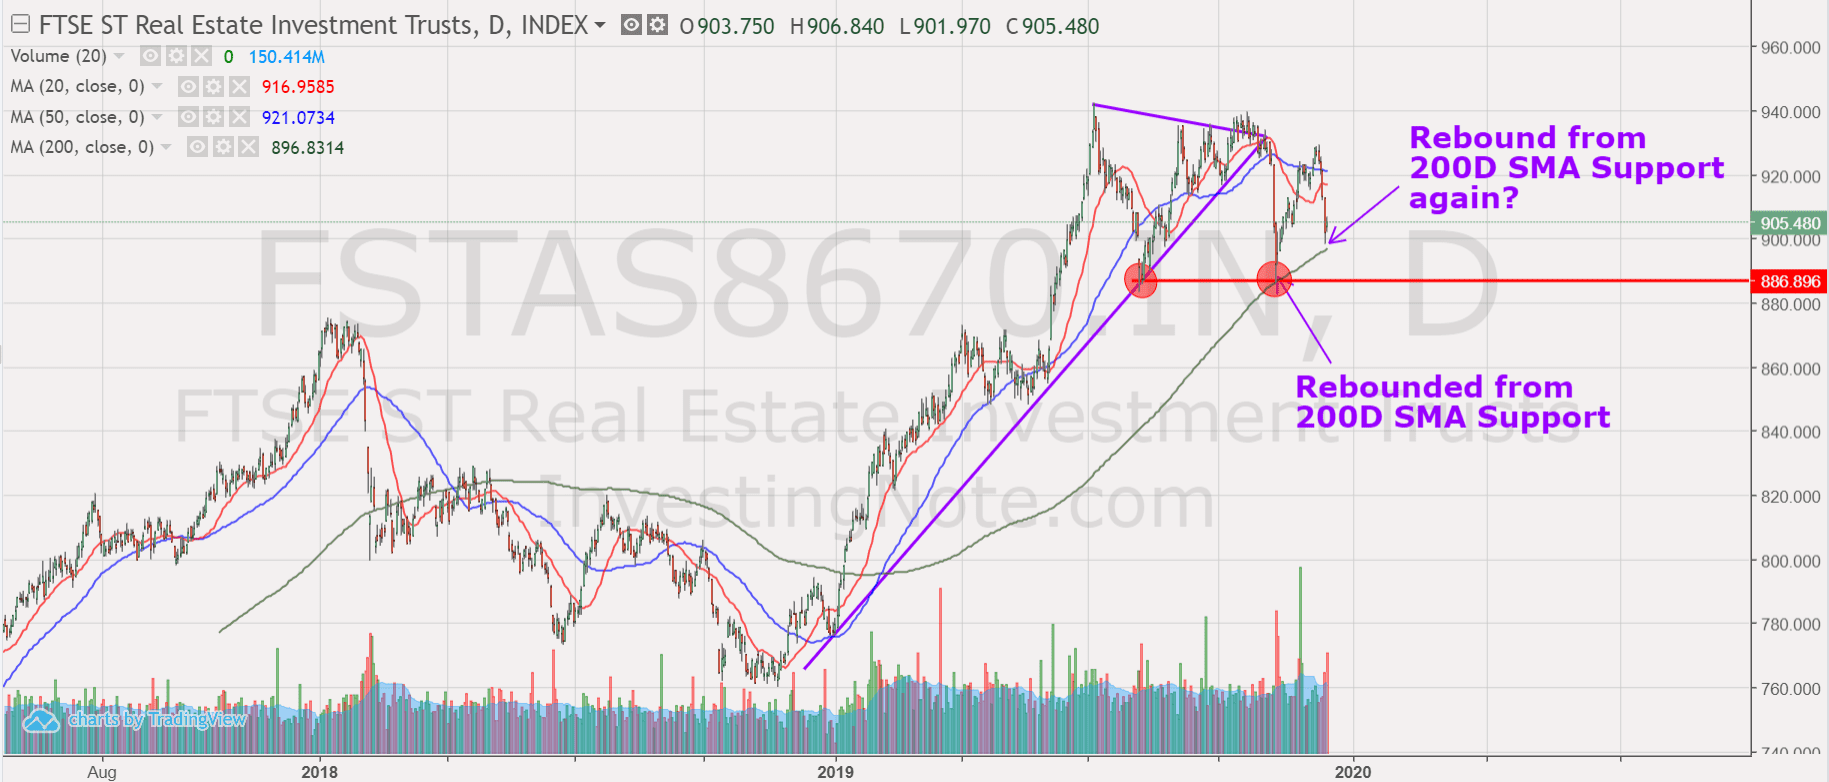
FTSE ST Real Estate Investment Trusts (FTSE ST REIT Index) is currently trading within a range between 940 and 887. The REIT index has changed from 906.82 (last post) to 905.48 (-0.14%). Based on the current chart pattern, the REIT index is retracing back to test the 200D SMA support. Probable direction for REIT index: Side way to Up. Also take note of the Multiple Tops formation which is a trend reversal pattern. Previous chart on FTSE ST REIT index can be found in the last post Singapore REIT Fundamental Comparison Table on Nov 17, 2019.
Fundamental Analysis of 40 Singapore REITs
The following is the compilation of 40 REITs in Singapore with colour coding of the Distribution Yield, Gearing Ratio and Price to NAV Ratio. This gives investors a quick glance of which REITs are attractive enough to have an in-depth analysis. DPU Yield for Eagle Hospitality Trust and Prime US REIT are projection based on the IPO prospectus. OUE Hospitality Trust is removed after merged into OUE Commercial REIT. Lendlease Global Commercial REIT is not included in this table. Fortune HKD REIT is removed as the REIT has been delisted.

- Price/NAV maintains at 1.08 (Singapore Overall REIT sector is over value now).
- Distribution Yield decreases from 6.29% to 6.28% (take note that this is lagging number). About 27.5% of Singapore REITs (11 out of 40) have Distribution Yield > 7%.
- Gearing Ratio maintains at 35.2%. 24 out of 40 have Gearing Ratio more than 35%. In general, Singapore REITs sector gearing ratio is healthy. Note: The current limit of gearing ratio for REITs listed in Singapore Stock Exchange is 45% but there is a consultation paper by SGX to review the potential increase to 50-55% limit.
- The most overvalue REIT is Keppel DC REIT (Price/NAV = 1.79), followed by Parkway Life (Price/NAV = 1.76), Ascendas REIT (Price/NAV = 1.42), Mapletree Industrial Trust (Price/NAV = 1.61), Mapletree Logistic Trust (Price/NAV = 1.42) and Mapletree Commercial Trust (Price/NAV = 1.33)
- The most undervalue (base on NAV) is Eagle Hospitality Trust (Price/NAV =0.57), followed by Lippo Malls Indonesia Retail Trust (Price/NAV = 0.75).
- The Highest Distribution Yield (TTM) is Eagle Hospitality Trust (12.42%) followed by SoilBuild BizREIT (9.13%), EC World REIT (8.04%), Lippo Mall Indonesia Retail Trust (8.93%), First REIT (8.64%) and Cache Logistic Trust (7.9%).
- The Highest Gearing Ratio are ESR REIT (41.6%), Far East HTrust (39.6%), OUE Comm REIT (40.5%).
- Top 5 REITs with biggest market capitalisation are Ascendas REIT ($9.06B), CapitaMall Trust ($8.92B), Capitaland Commercial Trust ($7.60B), Mapletree Commercial Trust ($6.54B) and Mapletree Logistic Trust ($6.04B)
- The bottom 3 REITs with smallest market capitalisation are BHG Retail REIT ($351M), Sabana REIT ($500M) and iREIT Global REIT ($507M)
Disclaimer: The above table is best used for “screening and shortlisting only”. It is NOT for investing (Buy / Sell) decision. To learn how to use the table and make investing decision, Sign up next REIT Investing Workshop here to learn how to choose a fundamentally strong REIT for long term investing for passive income generation.

- 1 month decreases from 1.82783% to 1.73933%
- 3 month increases from 1.83163% to 1.76731%
- 6 month decreases from 1.93450% to 1.82864%
- 12 month decreases from 2.09271% to 1.96792%
Summary
Fundamentally the whole Singapore REITs is over value now based on simple average on the Price/NAV. The big cap REITs are still quite expensive after the recent correction. Most of the DPU yield for big cap REIT is below 5% now such as CapitaCom Trust, CapitaMall Trust, Fraser Centerpoint Trust, Keppel DC REIT, Keppel REIT, Parkway Life REIT, Mapletree Com Trust, Mapletree Logistics Trust and Mapletree Industrial Trust. However, the yield remains attractive compared to other fixed income asset classes like corporate bonds and government bonds. The yield spread between big cap and small cap REIT remains wide.
Yield spread (reference to 10 year Singapore government bond of 1.785%) has tightened from 4.519% to 4.495%. The risk premium for small cap REIT is very attractive as compared to big cap REITs. This indicates value picks only in small and medium cap REITs. Do take note that some small cap REITs have started to move up.
Technically, the REIT index is still trading on a long term uptrend as 200D SMA is still sloping up but short term is trading within a range. Current macro factors are expected to continue to support the bull run of REIT index, there are, (1) low interest rate environment (2) potential relax of gearing ratio to 50-55% limit (3) TINA (There Is No Alternative) for other high yield asset classes. The positive sentiment may entice Singapore REITs to take on more debt to grow the current portfolio.
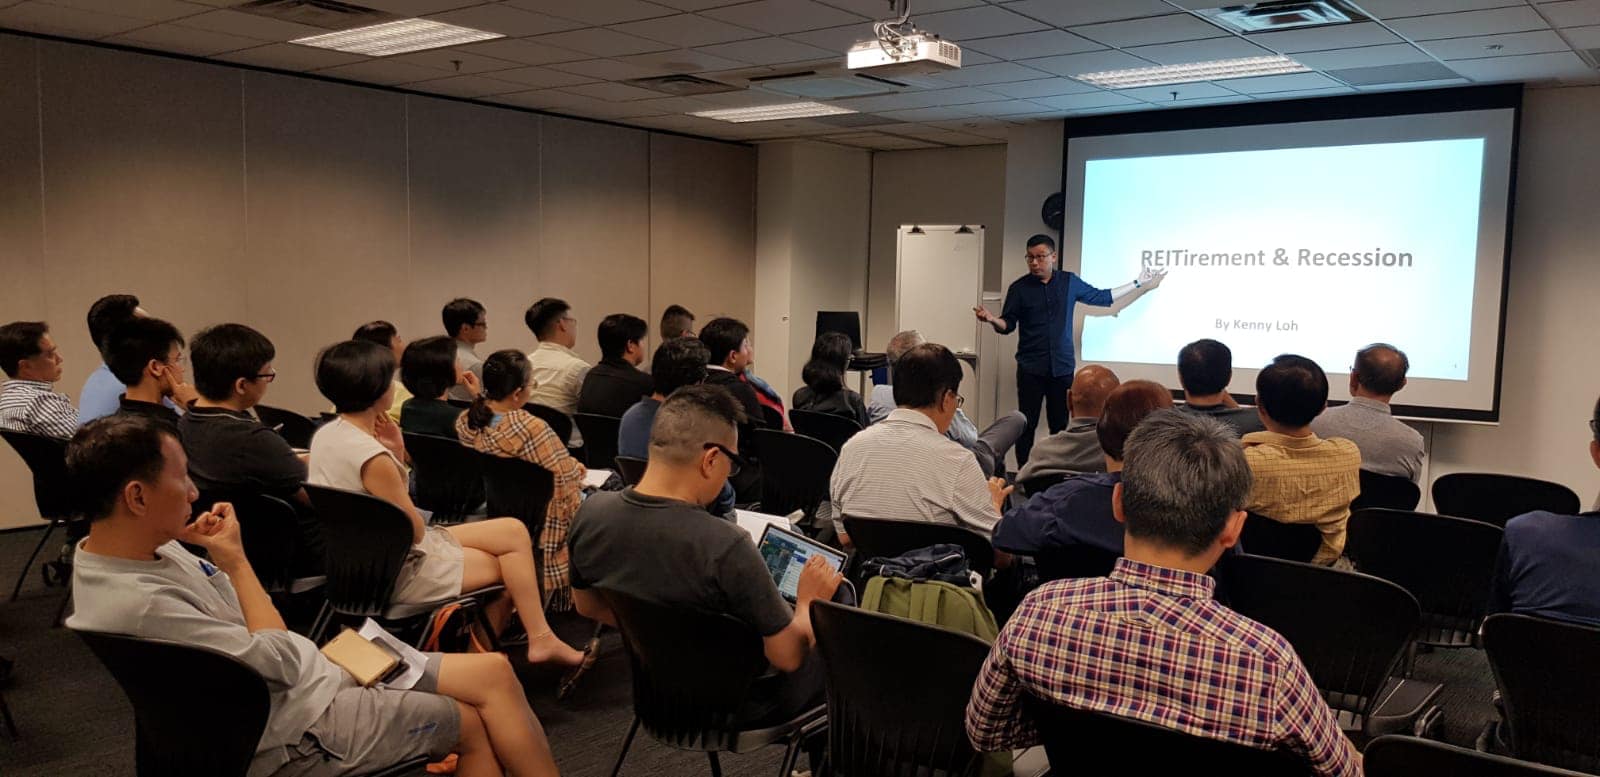
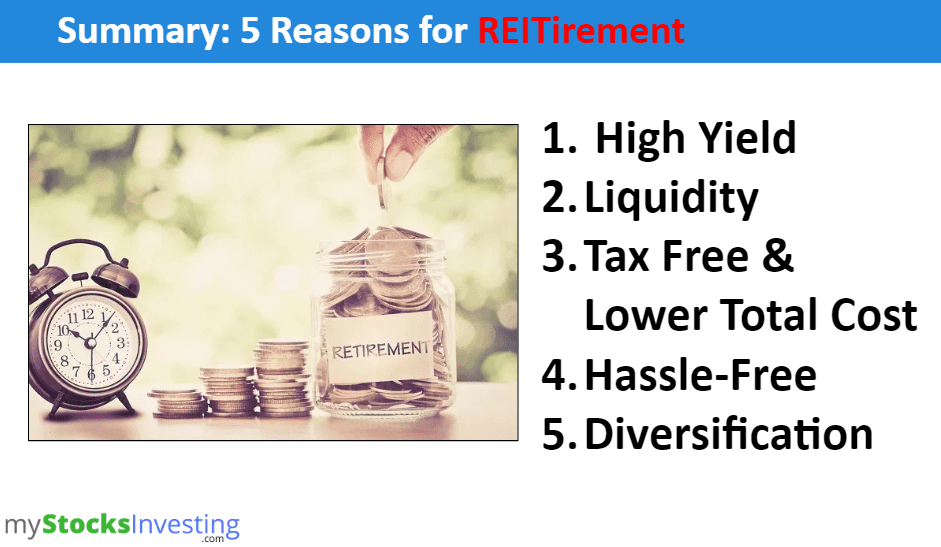
By the way, below is one page summary from my Dec 2019 Retirement Seminar, sharing the benefits of including REITs into our retirement portfolio. Happy REITirement!
My next Singapore REIT investing course is tentatively planned on April 2020. You may subscribe to the mailing list here if you want to be posted when the class registration is opened. https://mystocksinvesting.com/mailinglist/
For REIT Portfolio Consultation, please drop me an email marubozu@mystocksinvesting.com
I wish everyone a Merry Christmas and a prosperous 2020 New Year!


