Singapore REIT Sector 1H 2019 Market Outlook

  • Post author:

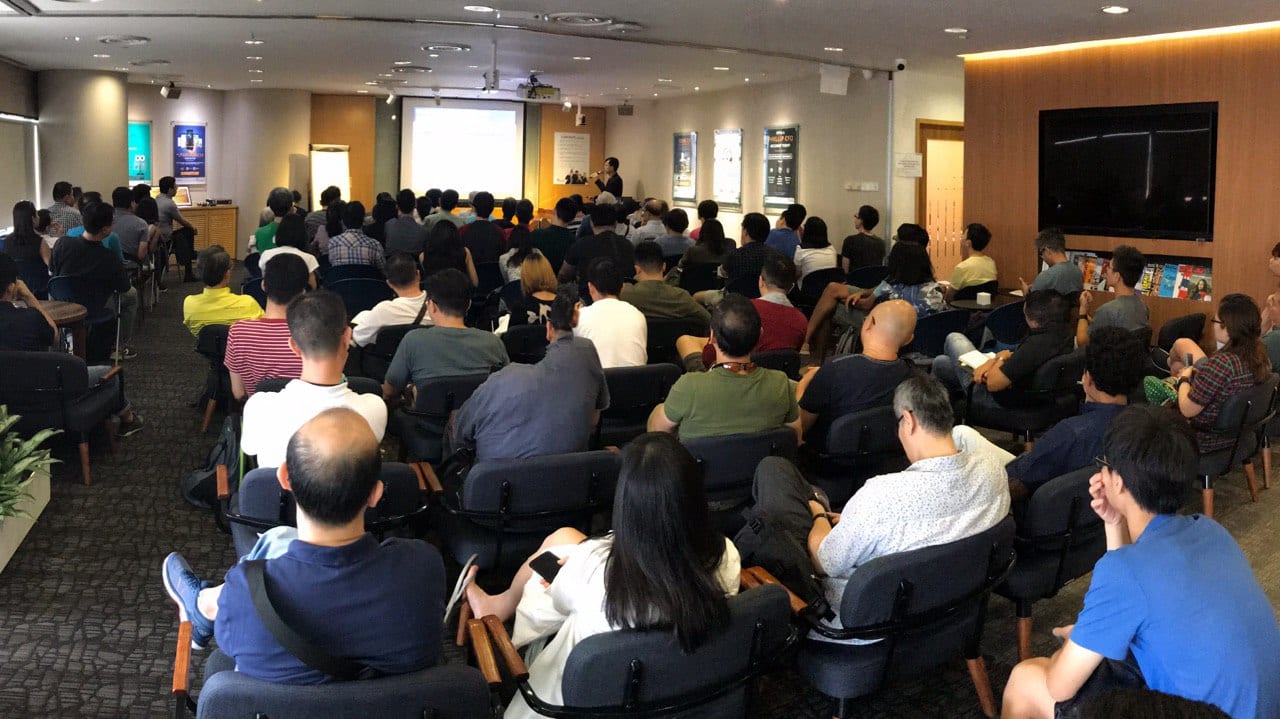
Conducted a Singapore REIT market outlook at Phillip Securities with invited speaker FIRST REIT CEO (Victor Tan) and Phillip Securities (Tara Wong) and Phillip Capital (Christopher Ao).


Tara shared about the current Singapore REIT sector market outlook and Christopher shared his view on how to build a diversified Singapore REIT portfolio using REIT Unit Trust.

Victor then shared his insights on the reasons why there was a huge plunge in FIRST REIT share price and future plan for FIRST REIT.

I then wrap up the session with my view on how to capture the opportunities and manage the risk of the REIT portfolio.

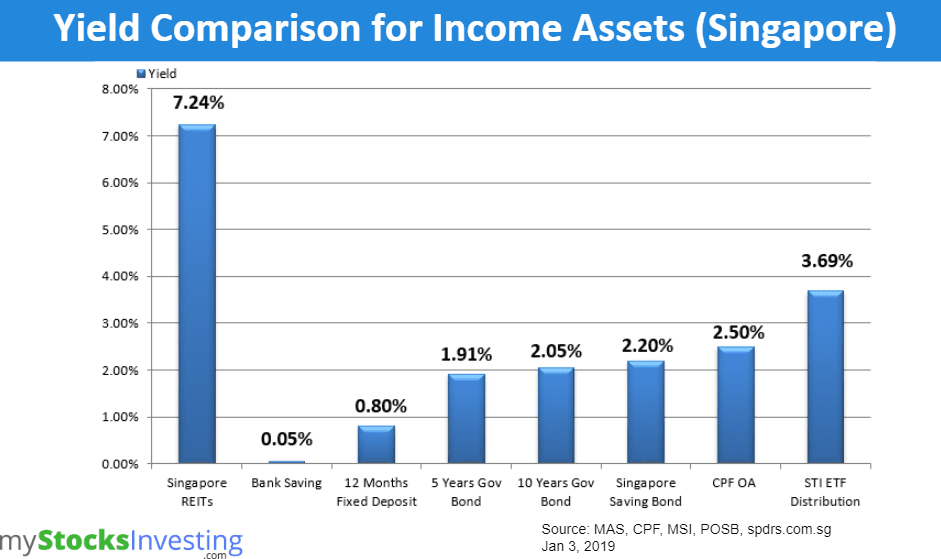
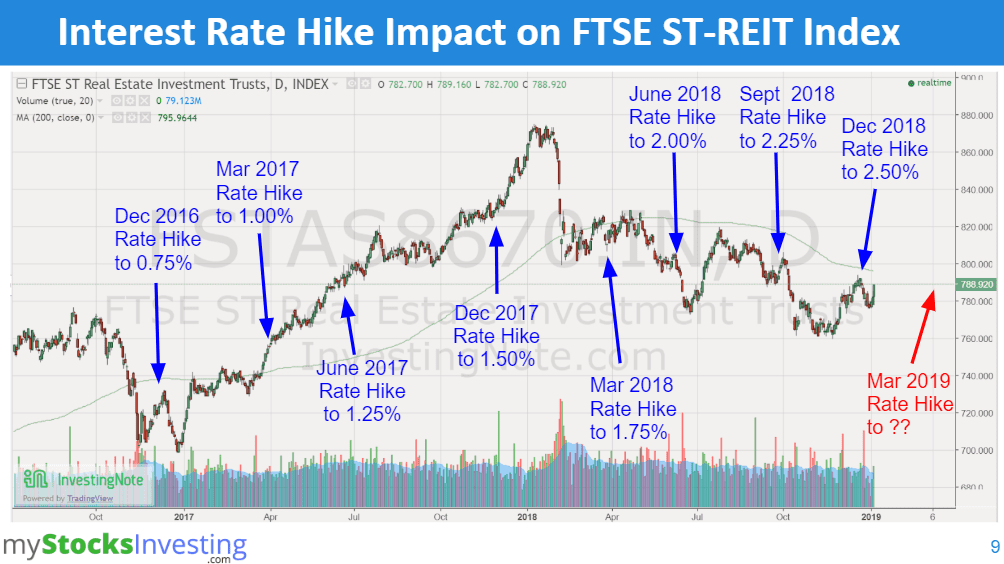
Please refer to additional charts and table below.

Singapore REIT Table

Singapore REIT Bubble Charts

Singapore REIT Price/NAV Range Chart


Lastly, I sincerely thank the invited speakers and the venue sponsor Phillip Securities for me to organise this exclusive private market update to my students, my clients and blog readers.


If you want to be informed on any seminar or market update in future, you can subscribe to my mailing list below.

Continue ReadingSingapore REIT Sector 1H 2019 Market Outlook

China Technology ETF and Stocks (NSYE & NASDAQ)

  • Post author:

By: Soh YJ


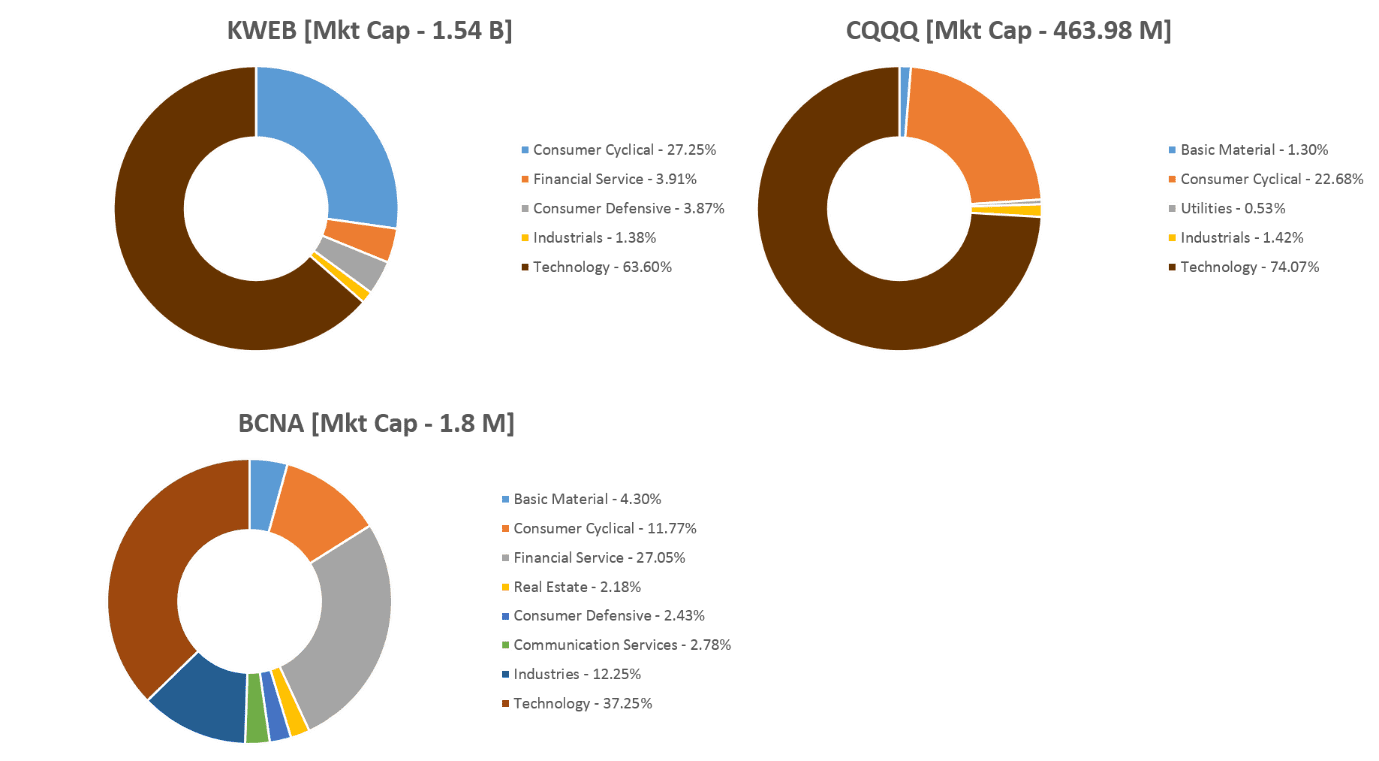
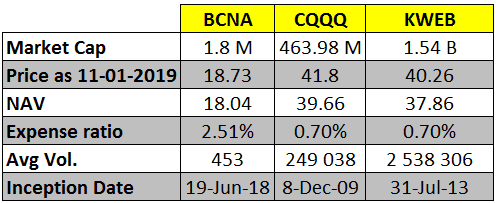
There are 3 china focused technology ETF that is traded in NSYE and NASDAQ. (1) BCNA, (2) CQQQ, (3) KWEB and the sector weighting are as below:

ETF Summary

KWEB is the better long term investment for china technology ETF. Due to relatively lower expense ratio, higher average volume. However, the expense ratio is still considered very high when compared with US Technology ETF, XLK (0.13%).


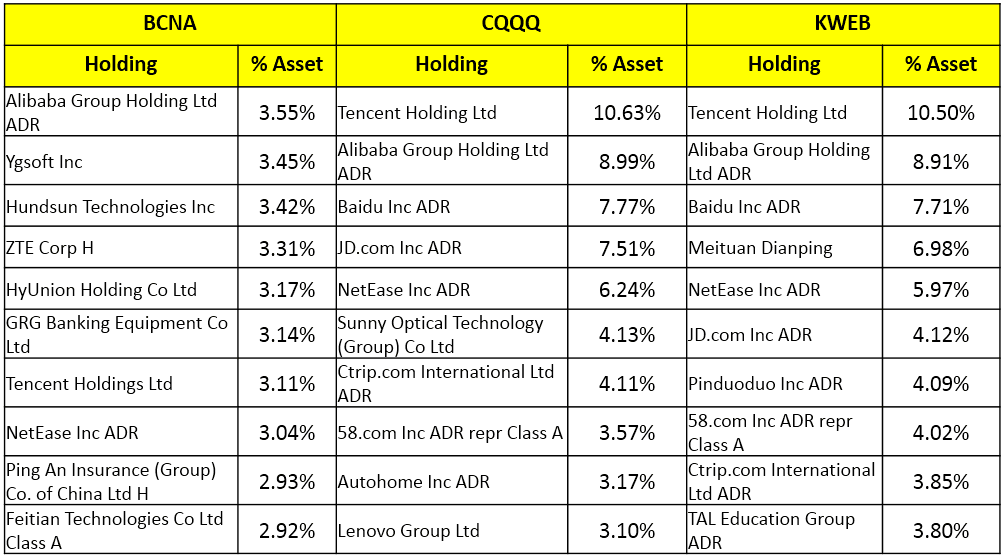
Top 10 Holdings of the ETFs


Performance of Individual Stocks VS KWEB

The below shows the growth of KWEB and its top 5 holdings. For china technology sector it would be better to focus on individual potential stock for higher growth and avoid unnecessary expenses. Buying individual Chinese stock will have a higher growth rate compared to ETF.

Top 3 Holdings of KWEB

The intrinsic value is calculated using 2 stage DCF model- 10yrs

[1 CNY = 1.16 HKD = 0.15 USD]

Cross Profit, Operation Cashflow and Net income of Top 3 KWEB Holding

Continue ReadingChina Technology ETF and Stocks (NSYE & NASDAQ)

Singapore REIT Bubble Charts Jan 2019

  • Post author:

Bubble charts derived from Jan 1, 2019 Singapore REITs Fundamental Comparison Table. Two observations compared to last Bubble Charts.

(1) No significant changes compared to last bubble chart. The yield spread between small/mid cap REIT and large cap REIT remains wide. This represents opportunities in small/medium cap REIT as risk premium is attractive. Note: Distribution yield is lagging.

(2) There are no significant changes in gearing ratio.


These Bubble Charts are used to show the “relative” position compare to other Singapore REITs.

Two visual bubble charts to pick and avoid:

  1. Undervalue Singapore REITs with High Distribution Yield** (Value Pick)
  2. Overvalue Singapore REITs with High Gearing Ratio (Risk Avoidance)

** Distribution Yield are lagging.

Compared to previous Singapore REIT Bubble Charts here.


Disclaimer: The analysis is for Author own use and NOT to be used as Buy / Sell recommendation. Get a proper training on “How to use this Singapore REIT Bubble Charts?” here.


Check below on other events:

https://mystocksinvesting.com/course/singapore-reits-investing/REITs Investing Course 

https://mystocksinvesting.com/course/private-portfolio-review/REITs Portfolio Advisory 

https://mystocksinvesting.com/events/

Continue ReadingSingapore REIT Bubble Charts Jan 2019