Singapore REIT Fundamental Analysis Comparison Table – 6 September 2019
Technical Analysis of FTSE ST REIT Index (FSTAS8670)
FTSE ST Real Estate Investment Trusts (FTSE ST REIT Index) continues its uptrend after finding support at the uptrend support at about 890-900, changing from 895.14 to 927.94 (+3.67%). Uptrend is still intact as long as the uptrend line support line holds. Previous chart on FTSE ST REIT index can be found in the last post Singapore REIT Fundamental Comparison Table on Aug 19, 2019.
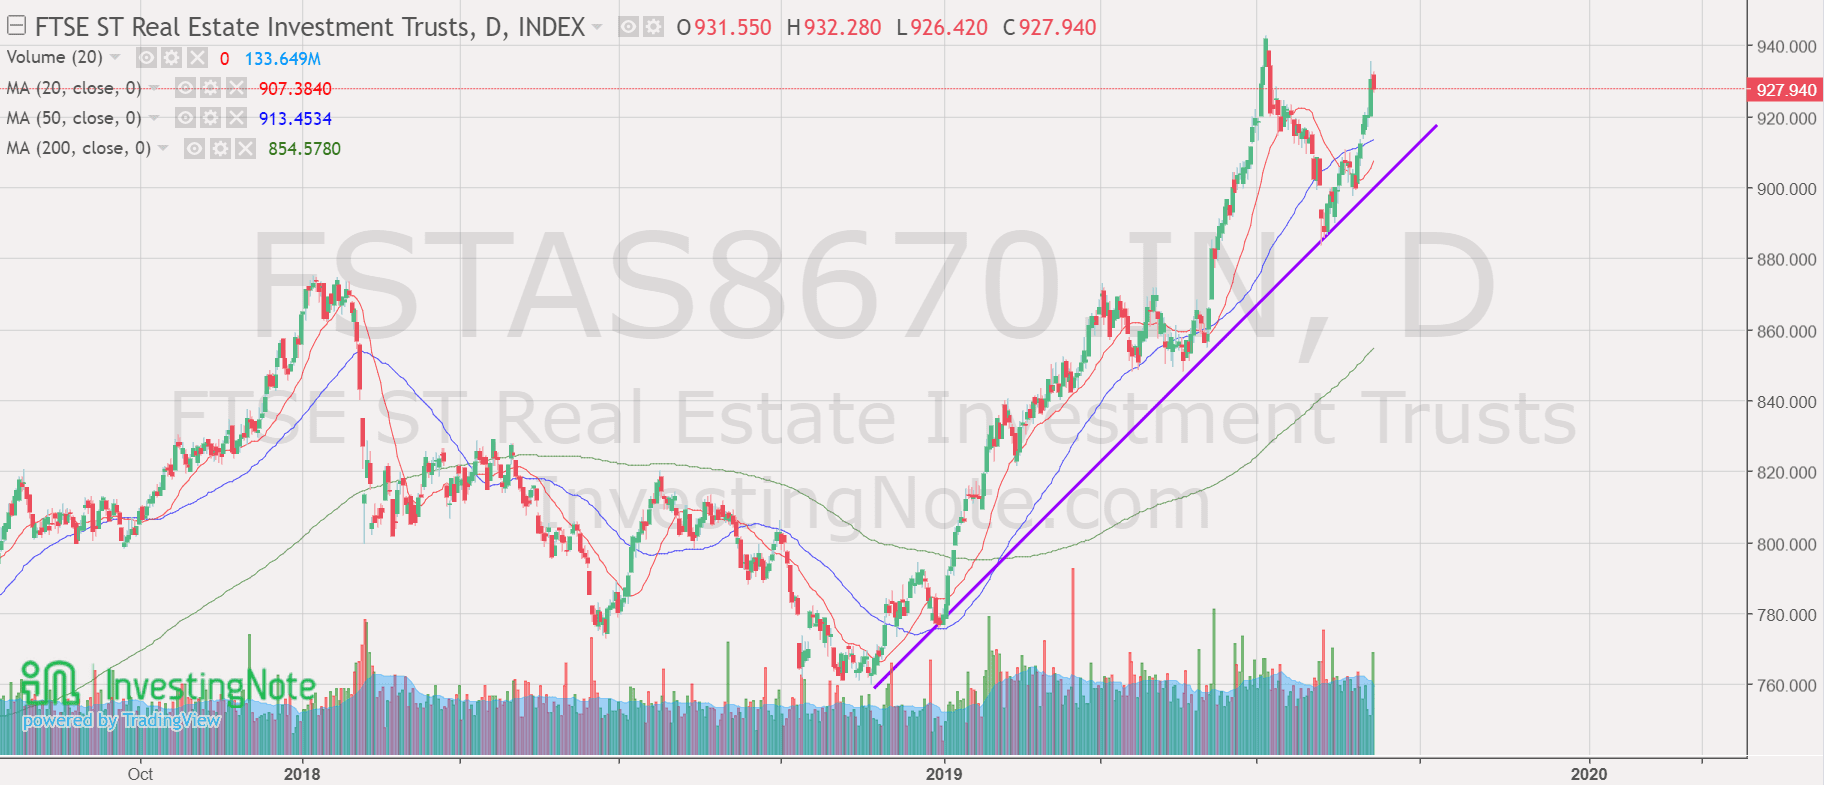
Based on the current chart pattern and and momentum, the sentiment is BULLISH and the trend for Singapore REIT direction is still UP. The recent selling is a healthy correction before the REIT index can move higher.
Fundamental Analysis of 42 Singapore REITs
The following is the compilation of 42 REITs in Singapore with colour coding of the Distribution Yield, Gearing Ratio and Price to NAV Ratio. This gives investors a quick glance of which REITs are attractive enough to have an in-depth analysis. Added 3 new IPO (ARA US Hospitality Trust, Eagle Hospitality Trust and Prime US REIT) in this month table. Do take note that distribution yield for these 3 newly IPO are just a projection based on the IPO prospectus.

- Price/NAV increases from 1.05 to 1.06 (Singapore Overall REIT sector is over value now).
- Distribution Yield maintains at 6.37% (take note that this is lagging number). About 33.3% of Singapore REITs (14 out of 42) have Distribution Yield > 7%.
- Gearing Ratio maintains at 34.7%. 24 out of 42 have Gearing Ratio more than 35%. In general, Singapore REITs sector gearing ratio is healthy. Note: The current limit of gearing ratio for REITs listed in Singapore Stock Exchange is 45% but there is a consultation paper by SGX to review the potential increase to 50-55% limit.
- The most overvalue REIT is Keppel DC REIT (Price/NAV = 1.75), followed by Parkway Life (Price/NAV = 1.68), Ascendas REIT (Price/NAV = 1.53), Mapletree Industrial Trust (Price/NAV = 1.54), Mapletree Logistic Trust (Price/NAV = 1.33), Frasers Logistic & Industrial Trust (Price/NAV = 1.36), CapitaMall Trust (Price/NAV = 1.30) and Mapletree Commercial Trust (Price/NAV = 1.42)
- The most undervalue (base on NAV) is Fortune REIT (Price/NAV = 0.52), followed by OUE Comm REIT (Price/NAV = 0.73), Far East Hospitality Trust (Price/NAV = 0.77) and Eagle Hospitality Trust (Price/NAV = 0.76)
- The Highest Distribution Yield (TTM) is Eagle HT (9.54%), followed by SoilBuild BizREIT (9.22%), Sasseur REIT (8.67%), EC World REIT (8.48%), Lippo Mall Indonesia Retail Trust (8.43%), First REIT (8.60%) ARA HT (8.28%).
- The Highest Gearing Ratio are Far East HTrust (39.8%), ESR REIT (39%), OUE Comm REIT (39.3%) and SoilBuild BizREIT (39.4%)
- Top 5 REITs with biggest market capitalisation are Ascendas REIT ($9.78B), CapitaMall Trust ($9.81B), Capitaland Commercial Trust ($7.99B), Mapletree Commercial Trust ($6.54B) and Mapletree Logistic Trust ($5.67B)
- The bottom 3 REITs with smallest market capitalisation are BHG Retail REIT ($350M), Sabana REIT ($479M) and iREIT Global REIT ($477M)
Disclaimer: The above table is best used for “screening and shortlisting only”. It is NOT for investing (Buy / Sell) decision. To learn how to use the table and make investing decision, Sign up next REIT Investing Workshop here to learn how to choose a fundamentally strong REIT for long term investing for passive income generation
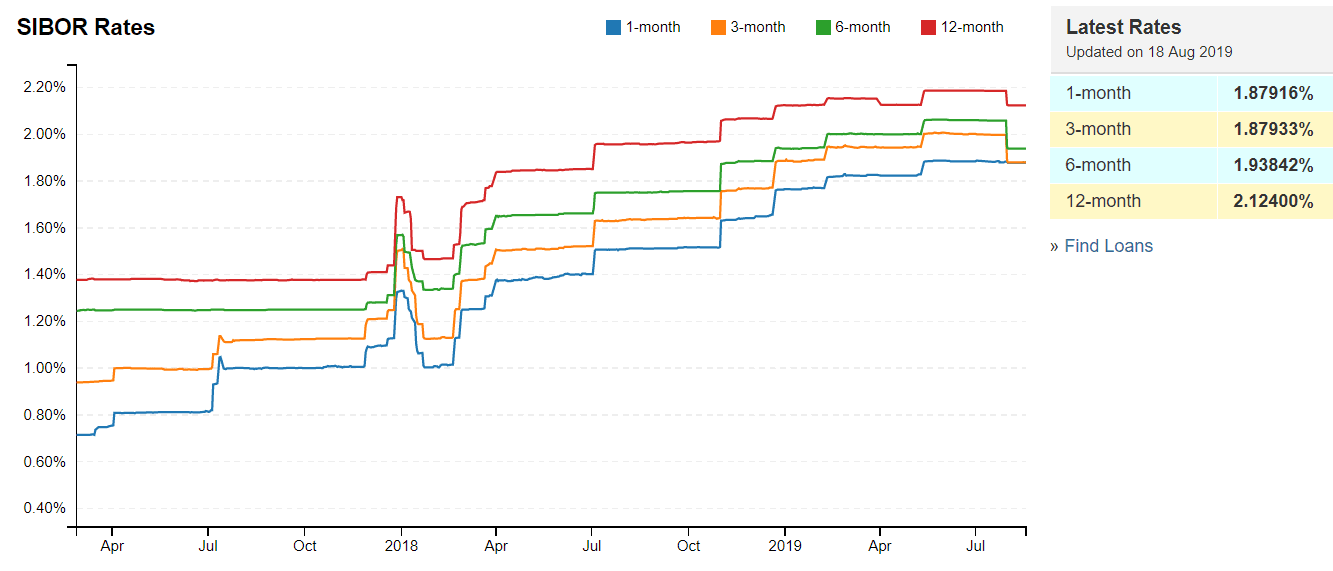
- 1 month decreases from 1.88250% to 1.87916%
- 3 month decreases from 1.99783% to 1.87933%
- 6 month decreases from 2.05792% to 1.93842%
- 12 month decreases from 2.18500% to 2.12400%
Summary
Fundamentally the whole Singapore REITs is over value now based on simple average on the Price/NAV. The big cap REITs are getting quite expensive and the distribution yield are still not attractive and most of the DPU yield for big cap REIT is below 5% now. Mapletree Commercial Trust has the lowest yield among the Singapore REITs is 4.08% now. The yield spread between big cap and small cap REIT remains wide. This indicates value picks only in small and medium cap REITs.
Yield spread (reference to 10 year Singapore government bond of 1.705%) has widened from 4.635% to 4.665%. DPU yield for a number of small and mid-cap REITs remains very attractive (>7%) after the recent minor correction. The risk premium for small cap REIT is attractive as compared to big cap REITs.
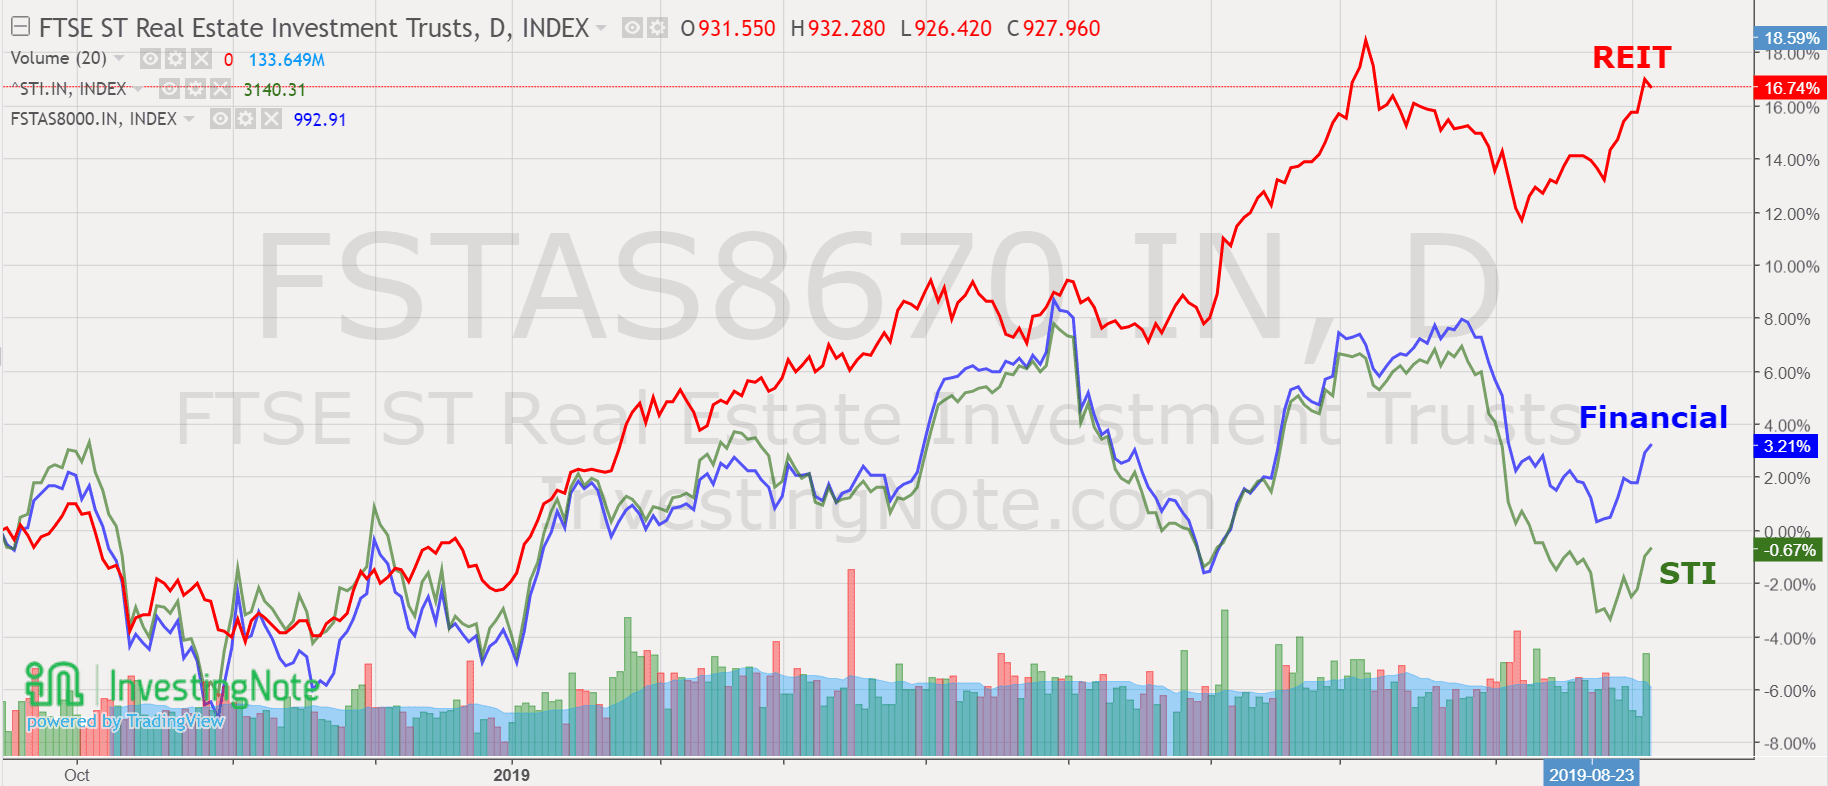
Technically, the REIT index continues the bullish uptrend after the recent retracement. REIT index continues to outperform STI and the financial sectors due to the following 3 macro factors (1) low interest rate environment (2) potential relax of gearing ratio to 50-55% limit (3) TINA (There Is No Alternative) for other high yield asset classes. The positive sentiment may entice Singapore REITs to take on more debt to grow the current portfolio.
My next Singapore REIT investing course is planned on Sept 21, 2019. Registration detail can be found at following link.
If you need an independent professional review on your current REIT portfolio and need any recommendation, you may engage me in the REIT portfolio Advisory. REITs Portfolio Advisory. https://mystocksinvesting.com/course/private-portfolio-review/