Singapore REIT Fundamental Analysis Comparison Table – 4 Feb 2019
Technical Analysis of FTSE ST REIT Index (FSTAS8670)
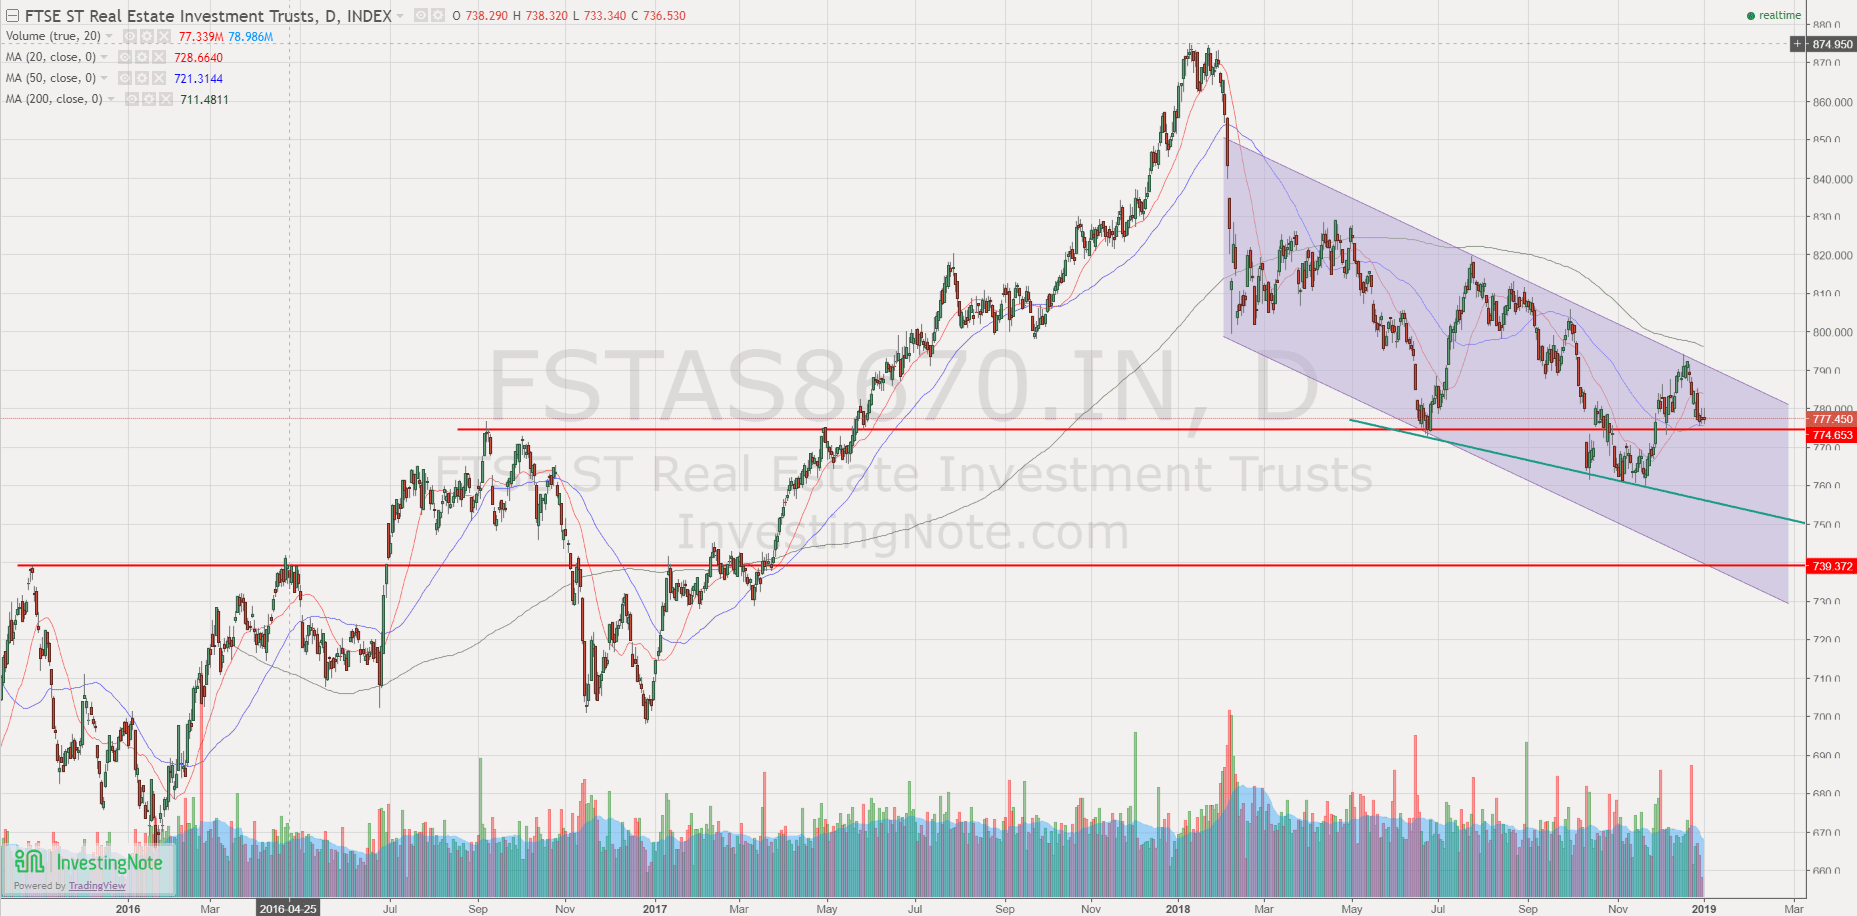
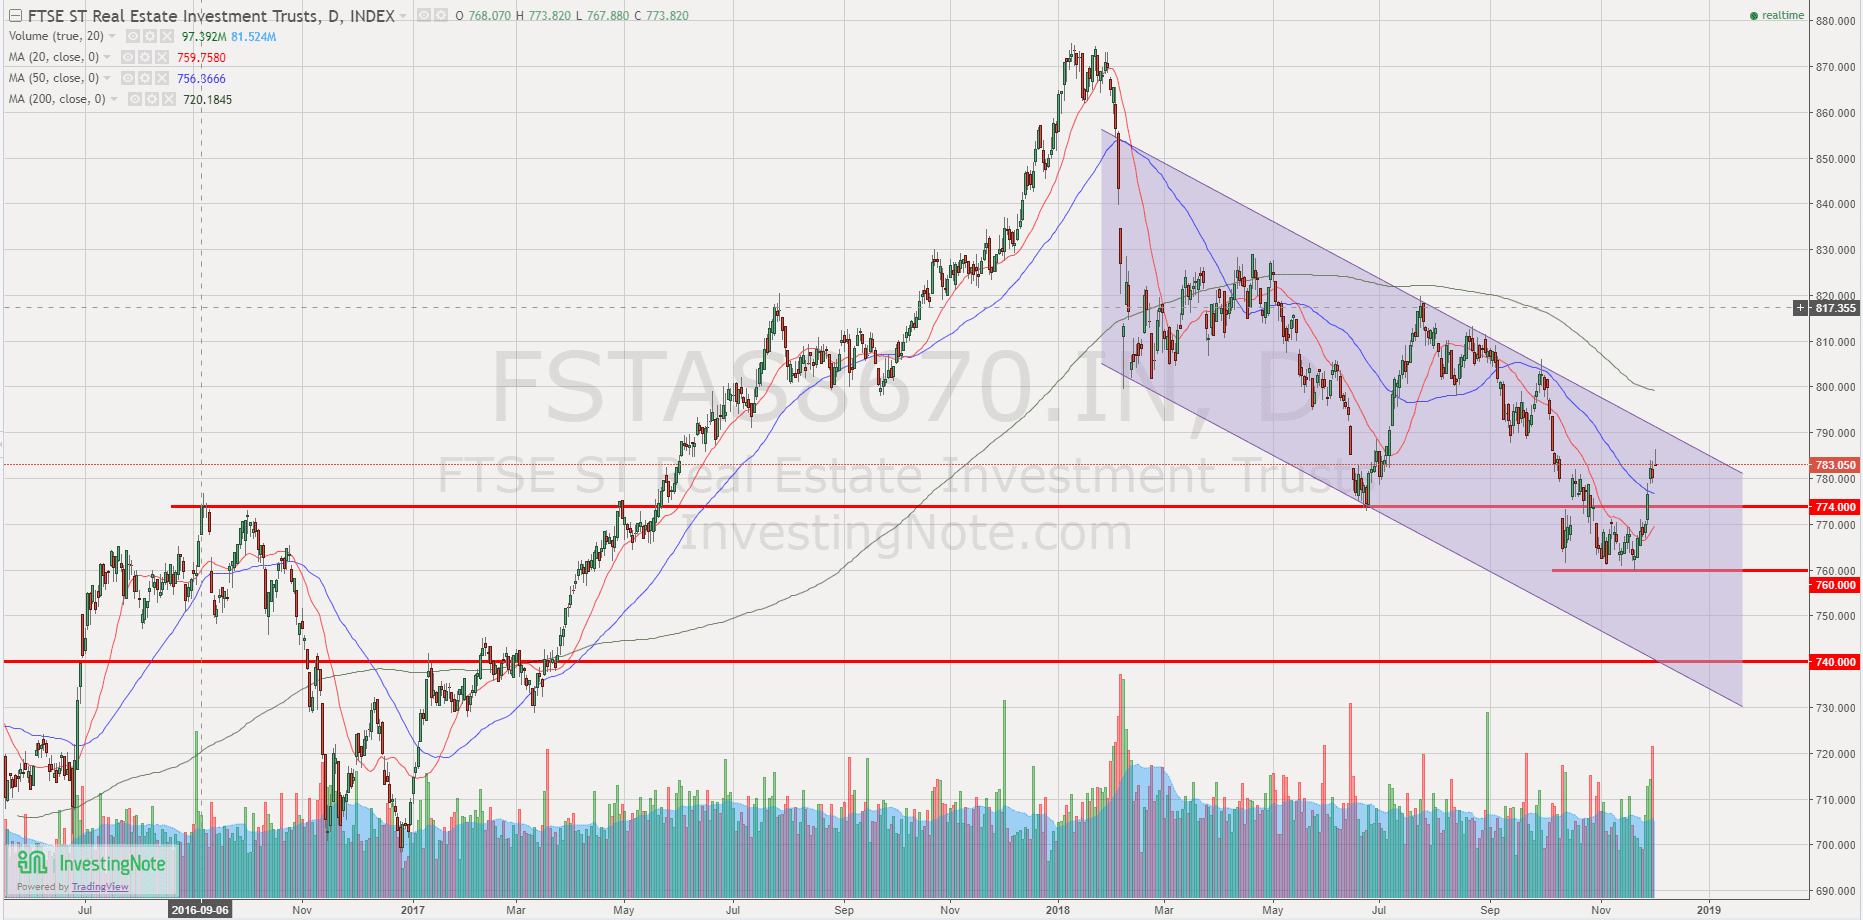
FTSE ST Real Estate Investment Trusts (FTSE ST REIT Index) had a huge rally last month from 777.45 to 832.03 (+7.00%) as compared to last post on Singapore REIT Fundamental Comparison Table on Jan 1, 2019.
The REIT index broke out from an down trend channel and critical resistance at 800, and reversed to an uptrend with spike in volume just in 1 month! This bull’s move was fast and furious! Most investors were not able to capture this large bullish move if they were not watching the stock market every day.

Based on the current chart pattern and trend analysis, the trend for Singapore REIT direction is UP! There is a chance for Singapore REIT index to test the immediate resistance at about 875 (the previous high in 2018) based on current market sentiment and bullish momentum. This represents another 5% upside potential before the REIT index can reach the new high. All eyes will be on whether the Singapore REIT can break the all time high at about 890 back in May 2016.
Immediate support at 820 followed by 800. If Singapore REIT index can stay above 800-820 support zone for the next few months, it is a high possibility that the bullish trend may continue to break new high. Bear in mind that Singapore REIT has one of the highest dividend yield compared to other stocks in Singapore and also other stock markets in the region.
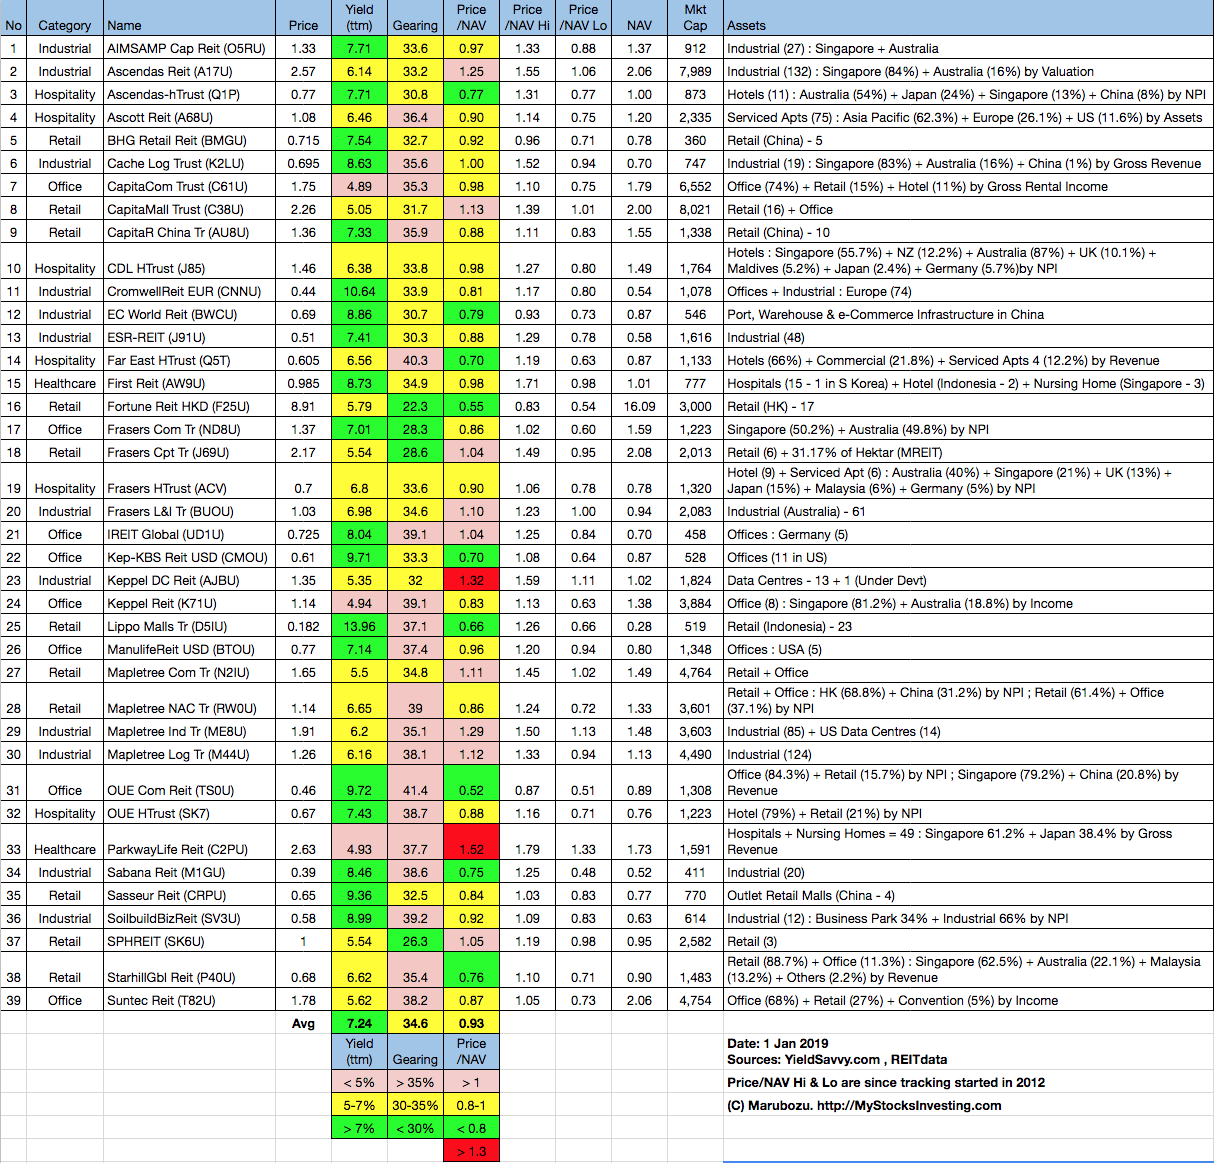
Fundamental Analysis of 39 Singapore REITs
The following is the compilation of 39 REITs in Singapore as of Dec 2018 with colour coding of the Distribution Yield, Gearing Ratio and Price to NAV Ratio. This gives investors a quick glance of which REITs are attractive enough to have an in-depth analysis. There are currently 39 REITs in Singapore after VIVA Industrial Trust merged into ESR REIT.

- Price/NAV increases from 0.93 to 1.01 (Singapore Overall REIT sector is at fair value now).
- Distribution Yield decreases from 7.24% to 6.72% (take note that this is lagging number). About 38.5% of Singapore REITs (15 out of 39) have Distribution Yield > 7%.
- Gearing Ratio increase from 34.6% to 35%. 22 out of 39 have Gearing Ratio more than 35%. In general, Singapore REITs sector gearing ratio is healthy. Note: The limit of gearing ratio for REITs listed in Singapore Stock Exchange is 45%.
- The most overvalue REIT is Parkway Life (Price/NAV = 1.54), followed by Keppel DC REIT (Price/NAV = 1.41), Mapletree Industrial Trust (Price/NAV = 1.36) and Ascendas REIT (Price/NAV = 1.33).
- The most undervalue (base on NAV) is Fortune REIT (Price/NAV = 0.58), followed by Far East Hospitality Trust (Price/NAV = 0.76), OUE Comm REIT (Price/NAV = 0.73) and Sabana REIT (Price/NAV = 0.72).
- The Highest Distribution Yield (TTM) is Lippo Mall Indonesia Retail Trust (10.37%), followed by Cromwell European REIT (9.85%), Sasseur REIT (9.43%), Keppel KBS US REIT (8.97%), SoilBuild BizREIT (8.73%), EC World REIT (8.43%) and Cache Logistic Trust (8.31%).
- The Highest Gearing Ratio are ESR REIT (41.9%), Far East HTrust (40.3%) and OUE Comm REIT (39.3%), iREIT Global (39.1%) and Mapletree NAC Trust (39%)
Disclaimer: The above table is best used for “screening and shortlisting only”. It is NOT for investing (Buy / Sell) decision. To learn how to use the table and make investing decision, Sign up next REIT Investing Seminar here to learn how to choose a fundamentally strong REIT for long term investing for passive income generation.

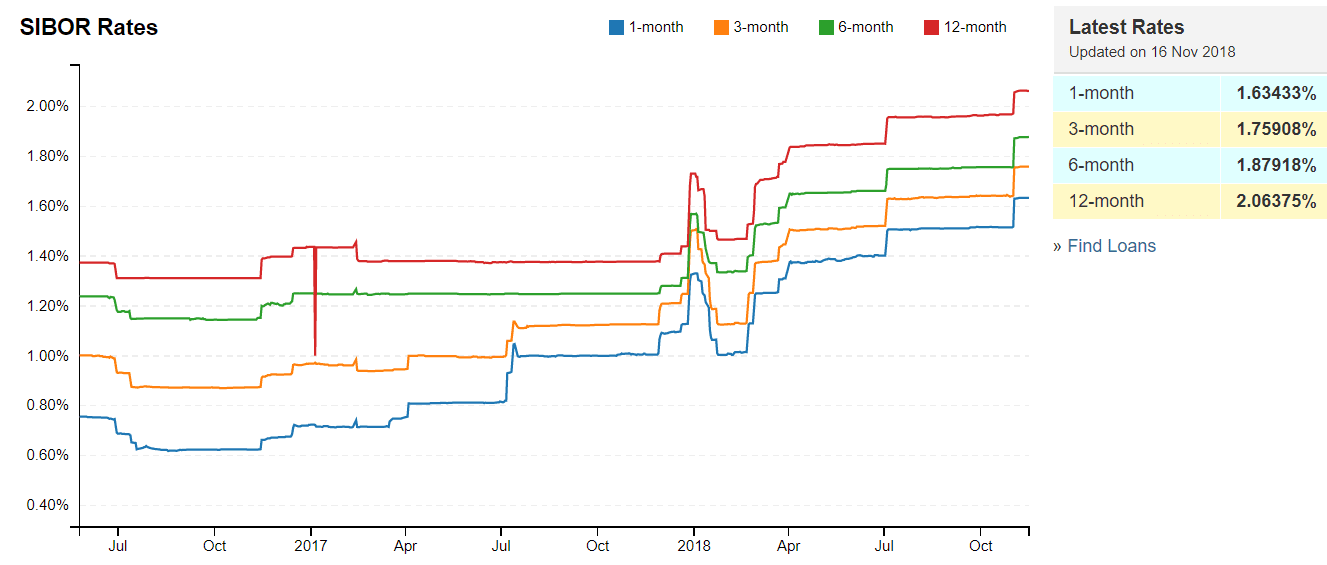
- 1 month increases from 1.64933% to 1.77009%
- 3 month increases from 1.76808% to 1.88892%
- 6 month increases from 1.88533% to 1.94080%
- 12 month increases from 2.06702% to 2.12550%
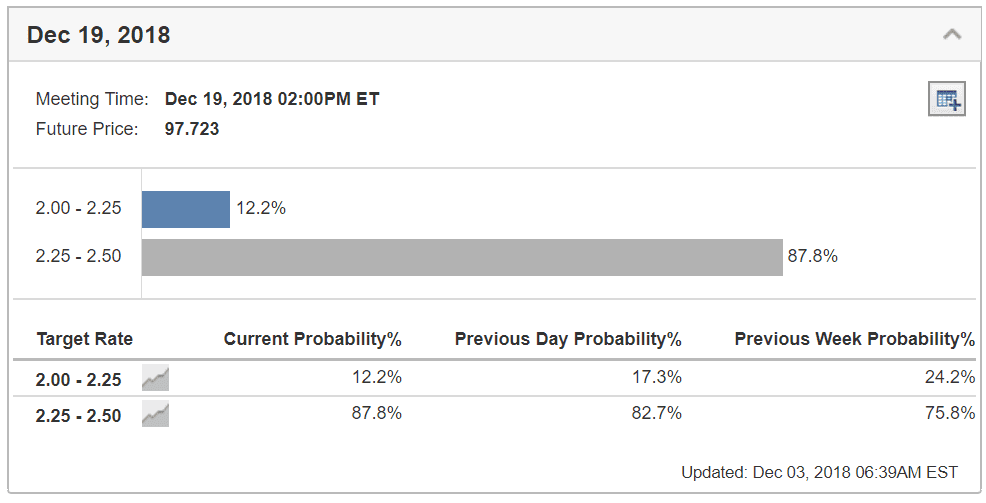
Based on current probability of Fed Rate Monitor, the US interest rate may stay at 2.5% for 2019.
Please visit the following link to see the summary of 1st half 2019 Singapore REIT market outlook session, a private event organised for my REIT class students.
Summary
Fundamentally the whole Singapore REITs is at fair value now. The sharp rally in Jan 2019 propelled the Price/NAV valuation from 0.93 (under value) to 1.01 (Fair value). The window of entry opportunity for big cap REIT is only 2 -3 months when I first highlighted in Nov 2018 post. The big cap REITs become more expensive again but there are still some value picks left in medium and small cap REITs.
Yield spread (reference to 10 year Singapore government bond (2.186%) has tightened from 5.19% to 4.53%. DPU yield for a number of small and mid-cap REITs are still very attractive (>8%) at the moment. However, it is expected the next move would be on small and medium size REITs due to higher risk premium.
Technically, the REIT index is trading in a bullish uptrend but it is expected to have a short term pause before moving higher.
I congratulate those investors who ignore the negative news and instead focus on the fundamental of the REITs to start accumulating in Nov and Dec 2018. You guys should have made handsome return (capital gain) in addition to the attractive dividend yield. I wish your Singapore REIT portfolio continue to do well in the new year!
Gong Xi Fa Cai!

See all other relevant Singapore REITs blog posts here.
If you need an independent professional review on your current REIT portfolio and need any recommendation, you may engage me in the REIT portfolio Advisory. REITs Portfolio Advisory. https://mystocksinvesting.com/course/private-portfolio-review/