Singapore REIT Fundamental Analysis Comparison Table – 1 Oct 2018
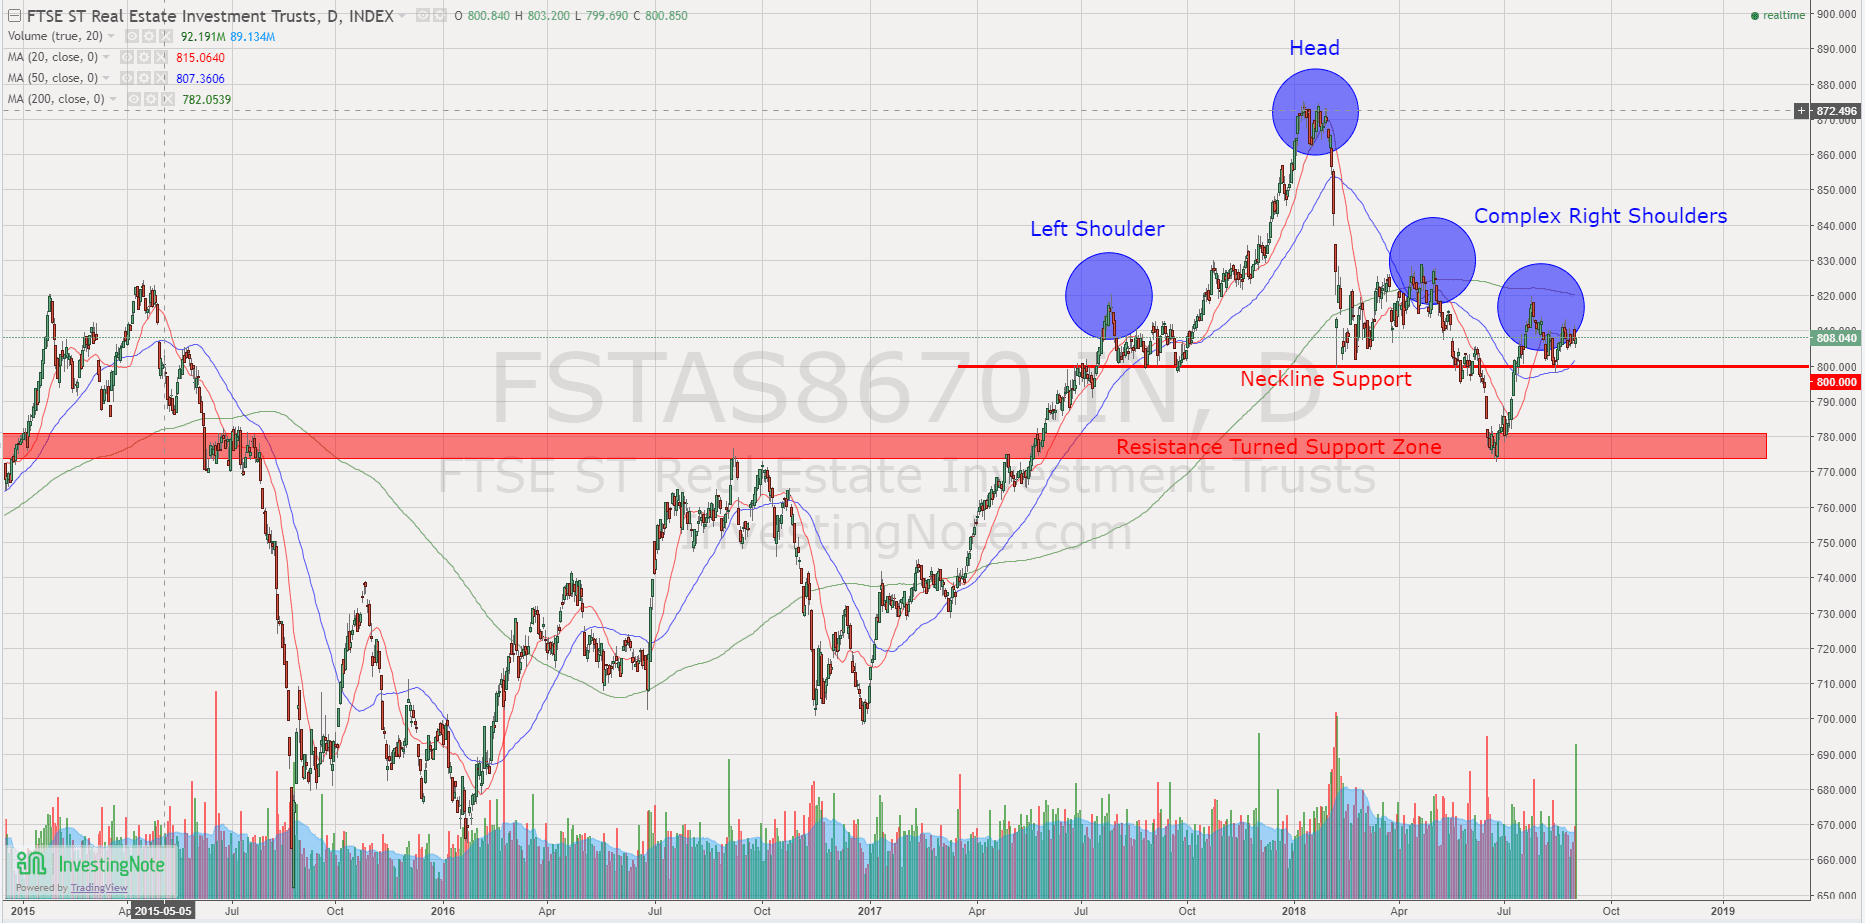
FTSE ST Real Estate Investment Trusts (FTSE ST REIT Index) decreased slightly from 808.04 to 802.97 (-0.63%) as compared to last post on Singapore REIT Fundamental Comparison Table on Sept 2, 2018. The REIT index continues to trade within a tight range between 800 and 820 and is currently forming a Symmetrical Triangle (a medium term consolidation chart pattern).
There are two chart patterns observed in this FTSE ST REIT Index. Head and Shoulders pattern is the trend reversal pattern, this is a bearish pattern. Symmetrical Triangle is a consolidation pattern, i.e. moving sideway. Thus, Short to Medium Term Singapore REIT direction: Side way to Down.

Fundamental Analysis

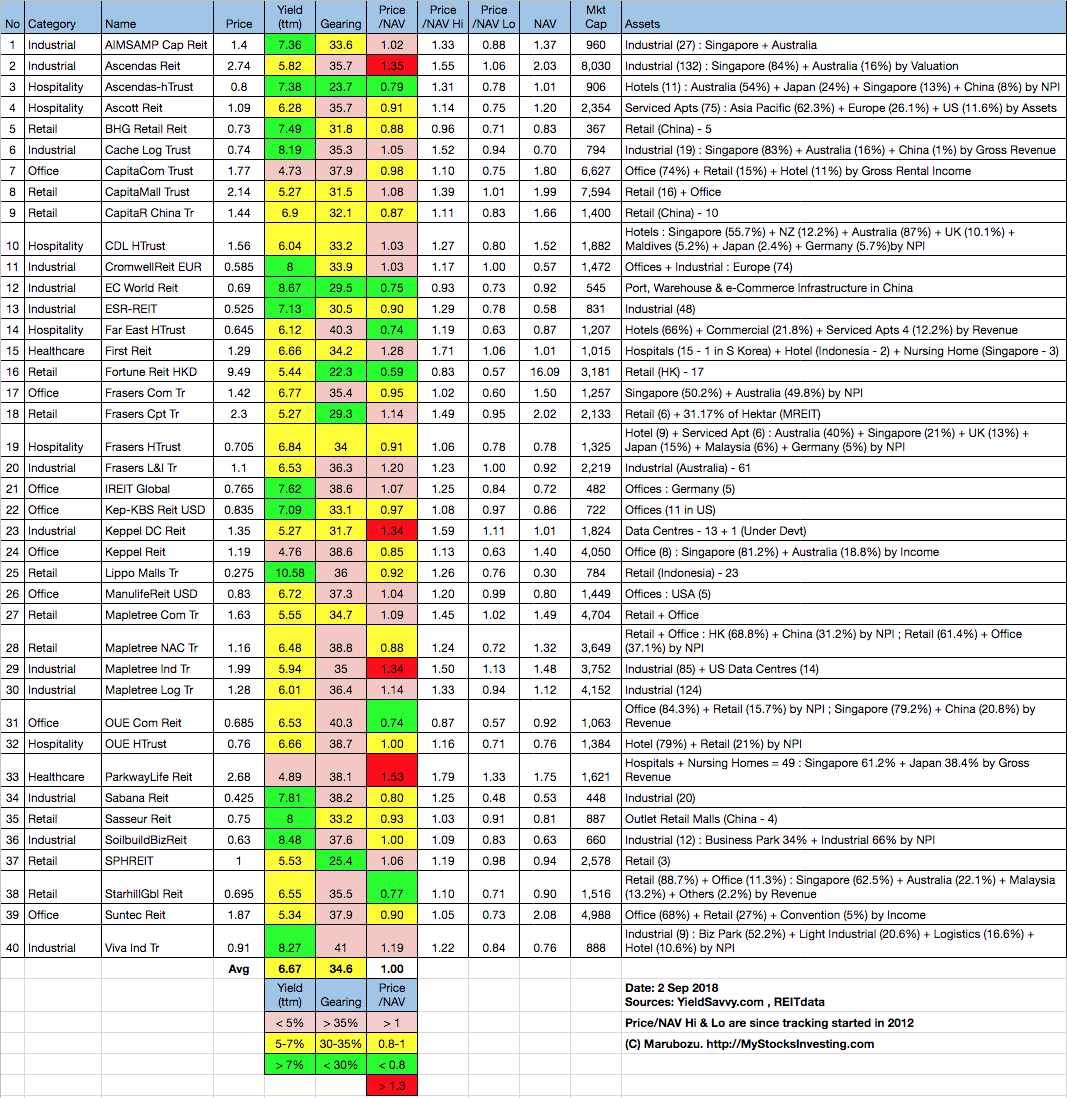
- Price/NAV decreases from to 1.00 to 0.99 (Singapore Overall REIT sector is slightly under value now).
- Distribution Yield increases from 6.67% to 6.77% (take note that this is lagging number). About one third of Singapore REITs (17 out of 40) have Distribution Yield > 7%.
- Gearing Ratio stays at 34.6%. 22 out of 40 have Gearing Ratio more than 35%. In general, Singapore REITs sector gearing ratio is healthy.
- Most overvalue REIT is Parkway Life (Price/NAV = 1.54), followed by Keppel DC REIT (Price/NAV = 1.36), Ascendas REIT (Price/NAV = 1.30) and Mapletree Industrial Trust (Price/NAV = 1.34).
- Most undervalue (base on NAV) is Fortune REIT (Price/NAV = 0.58), followed by Starhill Global REIT (Price/NAV = 0.77), Far East Hospitality Trust (Price/NAV = 0.73), OUE Comm REIT (Price/NAV = 0.67) and EC World REIT (Price/NAV = 0.77).
- Highest Distribution Yield (TTM) is Lippo Mall Indonesia Retail Trust (11.19%), followed by SoilBuild BizREIT (8.91%), Viva Industrial Trust (8.31%), Cromwell European REIT (8.14%), EC World REIT (8.49%), Sasseur REIT (8.28%) and Cache Logistic Trust (8.25%).
- Highest Gearing Ratio are Viva Industrial Trust (41%), Far East HTrust (40.3%) and OUE Comm REIT (40.3%).
Disclaimer: The above table is best used for “screening and shortlisting only”. It is NOT for investing (Buy / Sell) decision. To learn how to use the table and make investing decision, Sign up next REIT Investing Seminar here to learn how to choose a fundamentally strong REIT for long term investing for passive income generation.

- 1 month increases from 1.50784% to 1.51200%
- 3 month increases from 1.63239% to 1.63740%
- 6 month increases from 1.75000% to 1.75300%
- 12 month increases from 1.95692% to 1.96141%
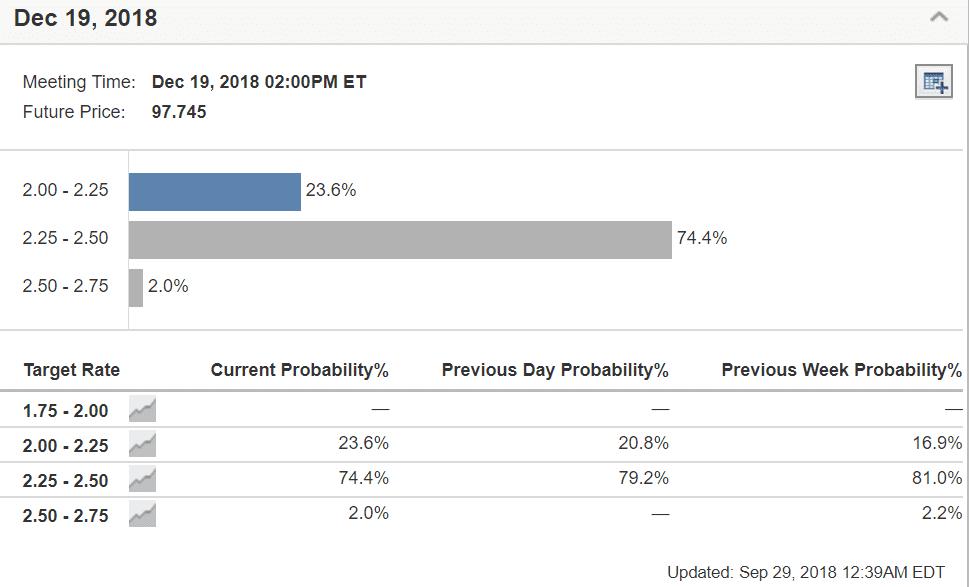
US Fed has increased the interest rate to 2.25% on Sept 26, 2018. There is no knee jerk reaction because FTSE ST REIT index has already priced in rate hike. Next watch is the rate hike in Dec 2018. The current probability of interest rate hike to 2.5% is 74.4%.
Summary
Fundamentally the whole Singapore REITs is slightly under value now. Overall yield for Singapore REIT is getting attractive (average yield of 6.77%). Yield spread (reference to 10 year Singapore government bond) has compressed to 4.238% (compared to previous month of 4.29%). DPU yield for a number of small and mid cap REITs are quite attractive (>7%) at the moment. However, technically, the REIT index is forming a Head and Shoulder trend reversal chart pattern, and currently trading side way in a symmetrical triangle pattern waiting for the breakout. More down side is expected if the 800 support level is broken. Small and medium cap REITs have reached an attractive entry level and investors can do some selective shopping now.
See all other relevant Singapore REITs blog posts here.
If you need an independent professional review on your current REIT portfolio and need any recommendation, you may engage me in the REIT portfolio Advisory. REITs Portfolio Advisory. https://mystocksinvesting.com/course/private-portfolio-review/
Finally I have sometimes to conduct the REITs Investing Course again in this coming Oct 2018.
Please check out the detail here and register online.