Singapore REIT Fundamental Analysis Comparison Table – 8 August 2016

  • Post author:

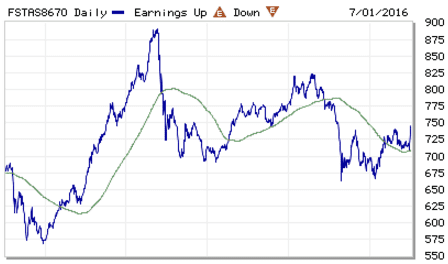
FTSE ST Real Estate Investment Trusts (FTSE ST REIT Index) increases from 745.33 to 756.17 (+1.45%) compare to last post on Singapore REIT Fundamental Comparison Table on July 3, 2016. The index broke out from Rectangle consolidation chart pattern and is currently forming a “Higher High, Higher Low” uptrend chart pattern. 200D SMA also starts to trend upward. This is the bullish sign and technically Singapore REIT sector is in bullish territory. SGX S-REIT (REIT.SI) Index increases from 1141.99 to 1162.02 (+1.05%)

FTSE ST REIT Index Aug7-2016

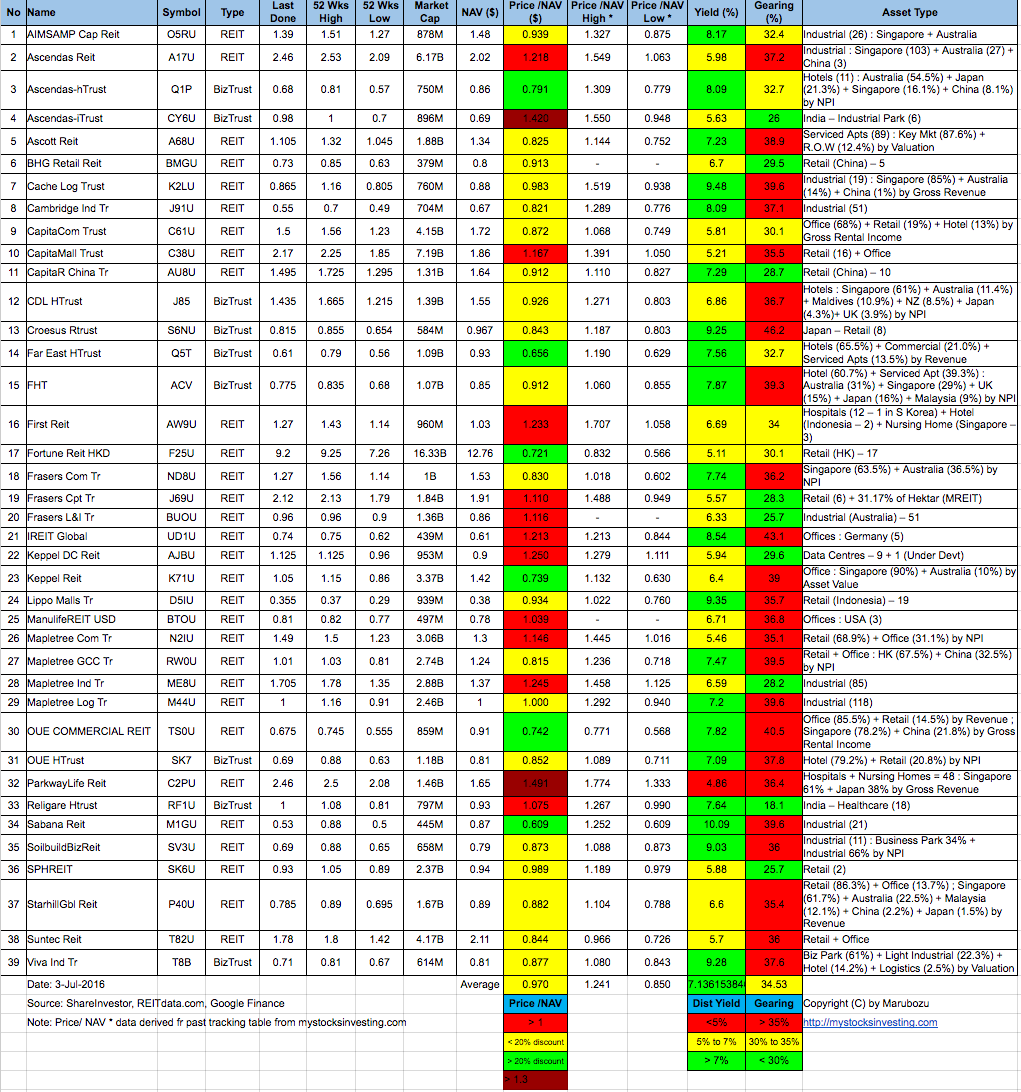
  • Price/NAV increases from  0.97 to 1.003 (Singapore Overall REIT sector at FAIR value now)
  • Distribution Yield decreases from 7.14% to 6.96% (take note that this is lagging number). More than half of Singapore REITs (19 out of 39) have Distribution Yield > 7%. Current yield is attractive (for certain REITs only) but it is dangerous to make investing decision purely base on the yield. Past performance does NOT equal to future performance.
  • Gearing Ratio decreases from 34.53% to 34.50%.  20 out of 39 have Gearing Ratio more than 35%.
  • Most overvalue is Ascendas iTrust (Price/NAV = 1.585), followed by Parkway Life (Price/NAV = 1.524).
  • Most undervalue (base on NAV) is Sabana REIT (Price/NAV = 0.65), followed by Far East HTrust (Price/NAV = 0.656) and Keppel REIT (Price/NAV = 0.752).
  • Higher Distribution Yield is Sabana REIT (9.52%), followed by VIVA Industrial Trust (9.51%) followed by Soilbuild Biz REIT (9.27%)
  • Highest Gearing Ratio is Croesus Retail Trust (46.2%), iREIT Global(43.1%) and OUE Commercial Trust (40.2%)

Singapore-REIT-Fundamental-Analysis-and-Comparison-Table-7-Aug-2016


Disclaimer: The above table is best used for “screening and shortlisting only”. It is NOT for investing (Buy / Sell) decision. To learn how to use the table and make investing decision, Sign up next REIT Investing Seminar here to learn how to choose a fundamentally strong REIT for long term investing for passive income generation.

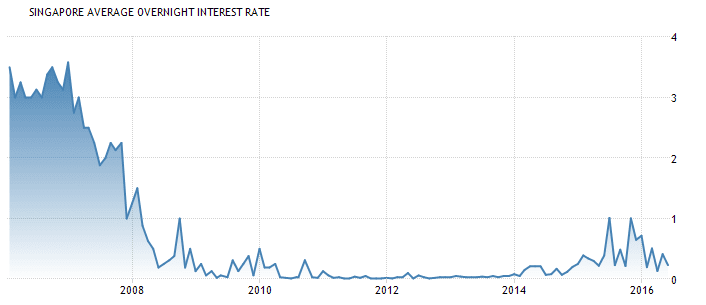
  • Singapore Interest Rate increases from 0.23% to 0.37%

Singapore Interest Rate Aug7-2016 SIBOR Aug7-2016

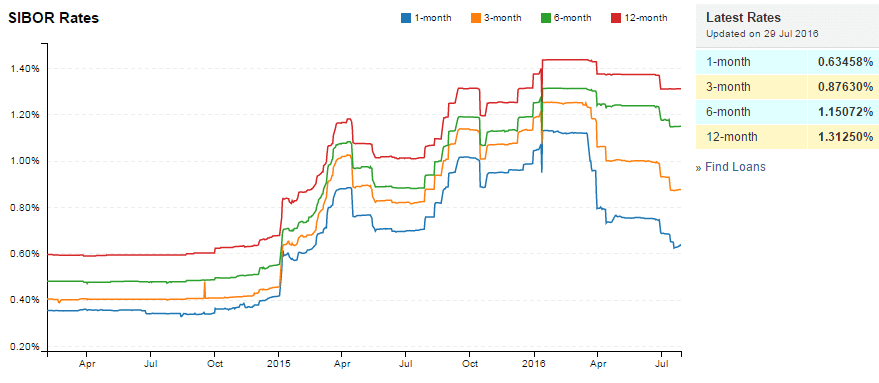
  • 1 month decreases 0.75000% to 0.63458%
  • 3 month decreases from 0.99463% to 0.87630%
  • 6 month decreases from 1.23466% to 1.15072%
  • 12 month decreases from 1.37375% to 1.31250%

Singapore Manufacturing PMI Aug7-2016

The Singapore PMI decreased to 49.3 in July of 2016 from 49.6 in the previous month, as sluggish global demand continued to weigh on the economic performance. The reading pointed to the thirteenth consecutive month of contraction, as new orders fell further to 49.0 (from 49.2 in June), new exports orders declined to 48.8 (from 48.9 in June) and output went down to 49.3 (from 49.4 in June). Manufacturing PMI in Singapore averaged 50.13 from 2012 until 2015, reaching an all time high of 51.90 in October of 2014 and a record low of 48.30 in October of 2012. Manufacturing PMI in Singapore is reported by the Singapore Institute of Purchasing & Materials Management, SIPMM.


Fundamentally Singapore REITs in general, the valuation is at Fair Value but distribution yields are still attractive. Technically Singapore REITs sector is in bullish territory and on uptrend. US Fed may delay the interest rate hike as there are a lot of uncertainties due to Brexit.  This may probably be the reason why Singapore REIT is coming back to life again!  Come and Learn How to Find Good Value Singapore REIT steps by steps to Invest at Singapore REITs Investing class.


Original post from https://mystocksinvesting.com


Continue ReadingSingapore REIT Fundamental Analysis Comparison Table – 8 August 2016

Singapore REIT Fundamental Analysis Comparison Table – 3 July 2016

  • Post author:

FTSE ST Real Estate Investment Trusts (FTSE ST REIT Index) increases from 717.26 to 745.33 (+3.91%) compare to last post on Singapore REIT Fundamental Comparison Table on June 5, 2016. The index rebounded strongly from 200D SMA support and stay above all the 20D/50D/200D SMA. 200D SMA also starts to trend upward. This is the bullish sign and technically Singapore REIT sector is in bullish territory. SGX S-REIT (REIT.SI) Index increases from 1102.94 to 1141.99 (+3.54%)


FTSE ST REIT Index July3-2016FTSE ST REIT Index July3a-2016

  • Price/NAV increases from  0.948 to 0.97 (Singapore Overall REIT sector is slightly under value now)
  • Distribution Yield decreases from 7.25% to 7.14% (take note that this is lagging number). More than half of Singapore REITs (20 out of 39) have Distribution Yield > 7%. Current yield is attractive (for certain REITs only) but dangerous to make investing decision purely base on the yield. Past performance does NOT equal to future performance.
  • Gearing Ratio decreases from 34.76% to 34.53%.  24 out of 39 have Gearing Ratio more than 35%.
  • Most overvalue is Parkway Life (Price/NAV = 1.491),  followed by Ascendas iTrust (Price/NAV = 1.42).
  • Most undervalue (base on NAV) is Sabana REIT (Price/NAV = 0.609), followed by Far East HTrust (Price/NAV = 0.656) andFortune REIT (Price/NAV = 0.721).
  • Higher Distribution Yield is Sabana REIT (10.09%), followed by Lippo Malls Trust (9.35%) followed by Cache Logistic Trust (9.48%)
  • Highest Gearing Ratio is Croesus Retail Trust (46.2%), iREIT Global(43.1%) and OUE Commercial Trust (40.5%)
  • Note: Recent IPO of Manulife US REIT and Frasers Logistic & Industrial Trust are added.

Singapore-REIT-Fundamental-Analysis-and-Comparison-Table-3-Jul-2016

Disclaimer: The above table is best used for “screening and shortlisting only”. It is NOT for investing (Buy / Sell) decision. To learn how to use the table and make investing decision, Sign up next REIT Investing Seminar here to learn how to choose a fundamentally strong REIT for long term investing for passive income generation.

  • Singapore Interest Rate maintains at 0.23%

Singapore Interest Rate July3-2016 SIBOR July3-2016

  • 1 month decreases 0.75634% to 0.75000%
  • 3 month decreases from 1.00192% to 0.99463%
  • 6 month decreases from 1.23863% to 1.23466%
  • 12 month maintains at 1.37375%

Fundamentally Singapore REITs in general, the valuation and distribution yields are still attractive. Technically Singapore REITs sector is in bullish territory and on uptrend. US Fed may delay the interest rate hike as there are a lot of uncertainties due to Brexit.  This may probably be the reason why Singapore REIT is coming back to life again!  Find out Which Singapore REIT to Buy, Which Sectors to consider,  and When is the Right Time to Buy in the next Singapore REITs Investing class.


Original post from https://mystocksinvesting.com

Continue ReadingSingapore REIT Fundamental Analysis Comparison Table – 3 July 2016

Singapore REIT Fundamental Analysis Comparison Table – 5 June 2016

  • Post author:


FTSE ST Real Estate Investment Trusts (FTSE ST REIT Index) decreases from 734.98 to 717.26  (-2.41%) compare to last post on Singapore REIT Fundamental Comparison Table on May 1, 2016. The index is just barely staying above 200D SMA (but sloping down) and forming a Head and Shoulder (a potential reversal pattern) with 200D SMA acts as the neckline support. Breaking this neckline support will probably send the index down to 660-670 region.  SGX S-REIT (REIT.SI) Index decreases from 1127.56 to 1102.94 (-2.18%)

FTSE ST REIT Index June4-2016 FTSE ST REIT Index June4a-2016

  • Price/NAV decreases from  0.965 to 0.948 (Singapore Overall REIT sector is under value now)
  • Distribution Yield increases from 7.1% to 7.25% (take note that this is lagging number). More than half of Singapore REITs (20 out of 38) have Distribution Yield > 7%. Current yield is attractive (for certain REITs only) but dangerous to make investing decision purely base on the yield. Past performance does NOT equal to future performance.
  • Gearing Ratio decreases from 34.92% to 34.76%.  24 out of 38 have Gearing Ratio more than 35%.
  • Most overvalue is Parkway Life (Price/NAV = 1.467),  followed by Ascendas iTrust (Price/NAV = 1.399).
  • Most undervalue (base on NAV) is Far East HTrust (Price/NAV = 0.656), Fortune REIT (Price/NAV = 0.676), followed by Sabana REIT (Price/NAV = 0.695).
  • Higher Distribution Yield is Lippo Malls Trust (9.91%) followed by Cache Logistic Trust (9.65%)
  • Highest Gearing Ratio is Croesus Retail Trust (46.2%), iREIT Global (43.1%) and OUE Commercial Trust (40.5%)
  • Note: Manulife US REIT is added.

Singapore-REIT-Fundamental-Analysis-and-Comparison-Table-5-Jun-2016


Disclaimer: The above table is best used for “screening and shortlisting only”. It is NOT for investing (Buy / Sell) decision. To learn how to use the table and make investing decision, Sign up next REIT Investing Seminar here to learn how to choose a fundamentally strong REIT for long term investing for passive income generation.


Singapore Average Overnight Interest Rate  

The benchmark interest rate in Singapore was last recorded at 0.23 percent. Interest Rate in Singapore averaged 1.67 percent from 1988 until 2016, reaching an all time high of 20 percent in January of 1990 and a record low of -0.75 percent in October of 1993. Interest Rate in Singapore is reported by the Monetary Authority of Singapore.

  • Singapore Interest Rate increases from 0.13% to 0.23%

Singapore Interest Rate June4-2016SIBOR June4-2016

  • 1 month increases 0.73701% to 0.75634%
  • 3 month increases from 1.00000% to 1.00192%
  • 6 month increases from 1.23521% to 1.23863%
  • 12 month increases from 1.37163% to 1.37375%


Singapore Manufacturing PMI  

The Singapore PMI was unchanged at 49.8 in May of 2016 from the previous month, posting its eleventh consecutive month of contraction. While new orders (49.7 from 49.8 in April) and employment (49.1 from 49.3) continued to fall, factory output increased for the first time in 11 months (50.1 from 49.9). Manufacturing PMI in Singapore averaged 50.13 from 2012 until 2015, reaching an all time high of 51.90 in October of 2014 and a record low of 48.30 in October of 2012. Manufacturing PMI in Singapore is reported by the Singapore Institute of Purchasing & Materials Management, SIPMM.Singapore Manufacturing PMI June 4-2016

Fundamentally Singapore REITs in general, the valuation and distribution yields are still attractive The US Fed’s rate hike fear may be already priced in as it has been dragged for too long. Most REITs have already prepared for it by actively managing their debts. Technically Singapore REITs index is probably moving side way or down base on the chart patterns (Rectangle and Head & Shoulder). Healthcare and sub-urban retail malls are resilient but Industrial, Office and Hospitality sectors are facing headwinds. Find out Which Singapore REIT to Buy, Which Sectors to consider,  and When is the Right Time to Buy in the next Singapore REITs Investing class.


Continue ReadingSingapore REIT Fundamental Analysis Comparison Table – 5 June 2016