Singapore REIT Fundamental Analysis Comparison Table – 7 May 2017

  • Post author:

FTSE ST Real Estate Investment Trusts (FTSE ST REIT Index) increases from 762.19 to 766.21 (+0.53%) ( compare to last post on Singapore REIT Fundamental Comparison Table on April 8, 2017. The index has broken 200D SMA resistance at about 740 and also but broke the declining resistance at 760. Also take note that all three simple moving averages are trending upward for the REIT index. Next resistance at 780.
Base on chart patterns (breakout from Double Bottoms and form Bull Flags), FTSE ST REIT Index should take a breather now trading within a consolidation range between 760-780.  SGX S-REIT (REIT.SI) Index increases from 1,172.85 to 1180.04 (+0.61%).


Update for this month Singapore REITs Table.

  • Data pulled from https://app.yieldsavvy.com/
  • Include Sector classification.
  • Remove 52 weeks high and low.
  • Remove stock code.
  • Remove Croesus Retail Trust, Religare Health Trust, Ascendas iTrust as these 3 are not REIT.

  • Price/NAV at 0.99  (Singapore Overall REIT sector is at fair value now).
  • Distribution Yield at 6.83% (take note that this is lagging number). More than half of Singapore REITs (16 out of 37) have Distribution Yield > 7%. High yield REITs mainly from Hospitality Trust and small cap Industrial REIT, but we must understand the risks while chasing for the high yield. Check out How to spot those Fundamentally strong REIT with attractive yield to build up a Passive Income Portfolio?
  • Gearing Ratio at  35.10%.  22 out of 37 have Gearing Ratio more than 35%.
  • Most overvalue is Parkway Life (Price/NAV = 1.47), FIRST REIT (Price/NAV = 1.34) and Keppel DC REIT (Price/NAV = 1.31).
  • Most undervalue (base on NAV) is Sabana REIT (Price/NAV = 0.61), followed by  Far East HTrust (Price/NAV = 0.67), Fortune REIT (Price/NAV = 0.70) and Keppel REIT (Price/NAV = 0.73)
  • Highest Distribution Yield (TTM) is Sabana REIT (10.2%), followed by Viva Industrial Trust (8.97%), SoilBuild BizREIT (8.86%) and Cache Logistic Trust (8.46%). All 4 REITs are small cap from Industrial sector.
  • Highest Gearing Ratio is Sabana REIT (43.2%), followed by Cache Logistic Trust (43.1%) and iREIT Global (41.6%).

Disclaimer: The above table is best used for “screening and shortlisting only”. It is NOT for investing (Buy / Sell) decision. To learn how to use the table and make investing decision, Sign up next REIT Investing Seminar here to learn how to choose a fundamentally strong REIT for long term investing for passive income generation.


  • Singapore Interest Rate remain the same at  0.57%.

  • 1 month increases from 0.74833% to 0.80850%
  • 3 month increases from  0.94580% to 0.99925%
  • 6 month increases from 1.24700% to 1.25000%
  • 12 month increases from 1.38000% to 1.38125%


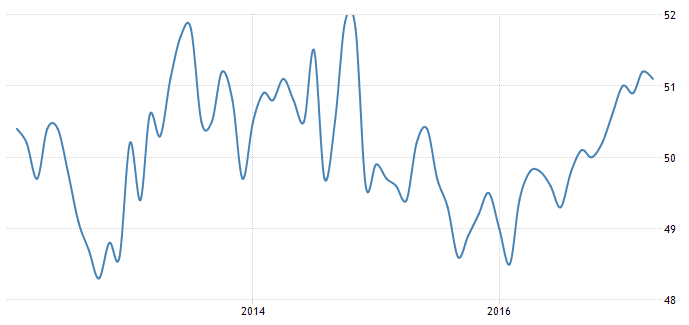
The Singapore Manufacturing PMI edged down to 51.1 in April of 2017 from a two-year high of 51.2 in the previous month. New orders, new exports orders, inventory, output, and employment rose at a slower pace. Also, stocks of finished goods shrank after logging seven months of expansion. Also, the PMI for electronics sector rose to 51.6 from 51.8 in March. Manufacturing PMI in Singapore averaged 50.03 from 2012 until 2016, reaching an all time high of 51.90 in October of 2014 and a record low of 48.30 in October of 2012.


The GDP in Singapore contracted an annualised 1.9 percent quarter-on-quarter in the first quarter of 2017, compared to a 12.3 percent expansion in the fourth quarter of 2016 and in line with market expectations, advance estimates showed. It was the strongest contraction since the third quarter of 2012, mainly due to a decrease in manufacturing (-6.6 percent from 39.8 percent in Q4 of 2016), and services (-2.2 percent from 8.4 percent in Q4). GDP Growth Rate in Singapore averaged 6.82 percent from 1975 until 2017, reaching an all time high of 37.20 percent in the first quarter of 2010 and a record low of -13.50 percent in the fourth quarter of 2008.


Fundamentally the whole Singapore REITs is at its fair value in average. There are also sign of recovery in Office and Hospitality sectors where the quarterly DPU has started to increase again. See Office Sector Bubble Charts and Hospitality Sector Bubble Charts here.

Technically Singapore REITs is on bullish up trend and currently taking a pause. More upside is expected if 780 resistance is broken.

The Singapore REITs seem have fully priced in the 2 remaining rate hikes this year as investors are back to hunt for REITs with good fundamental.  As big cap REITs have moved a lot for past few months, expect small cap REITs to play  catch up in the coming months. There are still some value picks for  REITs with good fundamental but we have to be very selective.

If you want to know how to identify those REITs, check out the next Investing in Singapore REIT course here.

Original post from https://mystocksinvesting.com

Check out coming seminars at https://mystocksinvesting.com/events


Continue ReadingSingapore REIT Fundamental Analysis Comparison Table – 7 May 2017

Singapore REIT Fundamental Analysis Comparison Table – 8 April 2017

  • Post author:

FTSE ST Real Estate Investment Trusts (FTSE ST REIT Index) increases from 732.6  to 762.19 (+4.03%) ( compare to last post on Singapore REIT Fundamental Comparison Table on Mar 6, 2017. The index has broken 200D SMA resistance at about 740 but currently facing a declining resistance at 760. Also take note that all three simple moving averages are trending upward for the REIT index. Next resistance at 780.   SGX S-REIT (REIT.SI) Index increases from 1,135.36 to 1,172.85 (+3.30%).


  • Price/NAV increases from 0.967  to 0.998 (Singapore Overall REIT sector is at fair value now).
  • Distribution Yield decreases from 7.03% to 6.78% (take note that this is lagging number). More than half of Singapore REITs (17 out of 40) have Distribution Yield > 7%. High yield REITs mainly from Hospitality Trust and small cap Industrial REIT, but we must understand the risks while chasing for the high yield. Check out How to spot those Fundamentally strong REIT with attractive yield to build up a Passive Income Portfolio?
  • Gearing Ratio no change at 34.76%.  21 out of 40 have Gearing Ratio more than 35%.
  • Most overvalue is Ascendas iTrust (Price/NAV = 1.57), followed by Parkway Life (Price/NAV = 1.53), FIRST REIT (Price/NAV = 1.327),  Keppel DC REIT (Price/NAV = 1.312) and Mapletree Industrial Trust (Price/NAV = 1.31)
  • Most undervalue (base on NAV) is Far East HTrust (Price/NAV = 0.659), followed by  Sabana REIT (Price/NAV = 0.682), Fortune REIT (Price/NAV = 0.695) and Keppel REIT (Price/NAV = 0.734)
  • Highest Distribution Yield is SoilBuild BizREIT (9.30%), followed by Viva Industrial Trust (8.81%) and Lippo Malls Indonesia Retail Trust (8.70%)
  • Highest Gearing Ratio is Croesus Retail Trust (46.1%), iREIT Global (41.6%), Sabana REIT (43.2%) and Cache Logistic Trust (43.1%).


Disclaimer: The above table is best used for “screening and shortlisting only”. It is NOT for investing (Buy / Sell) decision. To learn how to use the table and make investing decision, Sign up next REIT Investing Seminar here to learn how to choose a fundamentally strong REIT for long term investing for passive income generation.


  • Singapore Interest Rate increases from 0.22% to 0.57%.


  • 1 month increases from  0.71538% to 0.74833%
  • 3 month decreases from   0.94005% to 0.94580%
  • 6 month decreases from 1.24800% to 1.24700%
  • 12 month stays at  1.38000%


The Singapore Manufacturing PMI increased to 51.2 in March of 2017 from 50.9 in the previous month. The reading pointed to the strongest expansion in a factory activity since November of 2014, driven by higher levels of new orders, new exports, factory output, inventory, and employment. In contrast, finished goods and order backlog showed slower expansion. Also, the PMI for electronics sector rose to 51.8 from 51.4 in February. Manufacturing PMI in Singapore averaged 50.03 from 2012 until 2016, reaching an all time high of 51.90 in October of 2014 and a record low of 48.30 in October of 2012.


The GDP in Singapore advanced an annualized 12.3 percent on quarter in the last three months of 2016, recovering from a 0.4 percent contraction in the previous quarter and above earlier estimates of 9.1 percent. It is the strongest growth rate since the first quarter of 2011, mainly due to a rebound in manufacturing (+39.8 percent from -5 percent in Q3). GDP Growth Rate in Singapore averaged 6.86 percent from 1975 until 2016, reaching an all time high of 37.20 percent in the first quarter of 2010 and a record low of -13.50 percent in the fourth quarter of 2008.

Fundamentally the whole Singapore REITs is at its fair value in average. There are also sign of recovery in Office and Hospitality sectors where the quarterly DPU has started to increase again.

Technically Singapore REITs has broken the 200D SMA resistance and looks like starting an uptrend. However, the Singapore REITs Index has to clear 760 and 780 resistances to confirm the start of bullish trend.

The Singapore REITs seem have fully priced in the 2 remaining rate hikes this year as investors are back to hunt for REITs with good fundamental. There are still some value picks for  REITs with good fundamental but we have to be very selective. If you want to know how to identify those REITs, check out the next Investing in Singapore REIT course here.

See my Singapore REIT 2017 Market Outlook here.

Original post from https://mystocksinvesting.com

Check out coming seminars at https://mystocksinvesting.com/events

Continue ReadingSingapore REIT Fundamental Analysis Comparison Table – 8 April 2017

Singapore REIT Fundamental Analysis Comparison Table – 6 March 2017

  • Post author:

FTSE ST Real Estate Investment Trusts (FTSE ST REIT Index) increases from 732.7  to 732.6 (-0.01%) ( compare to last post on Singapore REIT Fundamental Comparison Table on Feb 5, 2017. The index is currently hovering around 200D SMA and moving sideway. FTSE ST Real Estate Investment Trust Index is currently trading within a Rectangle and expected to move within the range between 740 and 700.  SGX S-REIT (REIT.SI) Index increases from 1,127.74  to 1,135.36(+0.68%).


  • Price/NAV increases from 0.962 to 0.967 (Singapore Overall REIT sector is slightly under value now).
  • Distribution Yield decreases from 7.13%  to 7.03% (take note that this is lagging number). More than half of Singapore REITs (21 out of 40) have Distribution Yield > 7%. High yield REITs mainly from Hospitality Trust and small cap Industrial REIT, but we must understand the risks while chasing for the high yield. Check out How to spot those Fundamentally strong REIT with attractive yield to build up a Passive Income Portfolio?
  • Gearing Ratio decreases from 34.87% to 34.76%.  21 out of 40 have Gearing Ratio more than 35%.
  • Most overvalue is Ascendas iTrust (Price/NAV = 1.563), followed by Parkway Life (Price/NAV = 1.452), FIRST REIT (Price/NAV = 1.267) and Keppel DC REIT (Price/NAV = 1.253)
  • Most undervalue (base on NAV) is Sabana REIT (Price/NAV = 0.581), followed by Far East HTrust (Price/NAV = 0.643) and Fortune REIT (Price/NAV = 0.667).
  • Highest Distribution Yield is SoilBuild BizREIT (9.74%), followed by Cache Logistic Trust (9.02%) and Viva Industrial Trust (8.98%). All these 3 are small Cap Industrial REITs.
  • Highest Gearing Ratio is Croesus Retail Trust (46.1%), iREIT Global (41.6%), Sabana REIT (43.2%) and Cache Logistic Trust (43.1%).


Disclaimer: The above table is best used for “screening and shortlisting only”. It is NOT for investing (Buy / Sell) decision. To learn how to use the table and make investing decision, Sign up next REIT Investing Seminar here to learn how to choose a fundamentally strong REIT for long term investing for passive income generation.


  • Singapore Interest Rate decreases from 0.46% to 0.22%.


  • 1 month increases from 0.71463% to 0.71538%
  • 3 month decreases from  0.96188% to 0.94005%.
  • 6 month increases from 1.24700% to 1.24800%
  • 12 month decreases from 1.43517% to 1.38000%


The Singapore Manufacturing PMI decreased slightly to 50.9 in February of 2017 from 51 in the previous month. The reading pointed to the to the sixth consecutive expansion in a factory activity, while new orders, exports, and factory output rose at a slower pace. Also, the PMI for electronics sector declined to 51.4 from 51.8 in January. Manufacturing PMI in Singapore averaged 50.03 from 2012 until 2016, reaching an all time high of 51.90 in October of 2014 and a record low of 48.30 in October of 2012.

The GDP in Singapore advanced an annualized 12.3 percent on quarter in the last three months of 2016, recovering from a 0.4 percent contraction in the previous quarter and above earlier estimates of 9.1 percent. It is the strongest growth rate since the first quarter of 2011, mainly due to a rebound in manufacturing (+39.8 percent from -5 percent in Q3). GDP Growth Rate in Singapore averaged 6.86 percent from 1975 until 2016, reaching an all time high of 37.20 percent in the first quarter of 2010 and a record low of -13.50 percent in the fourth quarter of 2008.

Singapore REITs sector is currently range bound and FTSE ST REIT index is expected to trade within a range between 700 to 740. 700 support level could be a good level to accumulate some fundamental strong REITs as the valuation base on Price/NAV and Distribution yield can become attractive again.  Two questions may interest all the retail investors: WHEN is the right and safe time and WHAT REIT to pick? Check out the next Investing in Singapore REIT course here.

See my Singapore REIT 2017 Market Outlook here.

Original post from https://mystocksinvesting.com

Check out coming seminars at https://mystocksinvesting.com/events


Continue ReadingSingapore REIT Fundamental Analysis Comparison Table – 6 March 2017