Singapore REIT Fundamental Analysis Comparison Table – 7 August 2017

  • Post author:

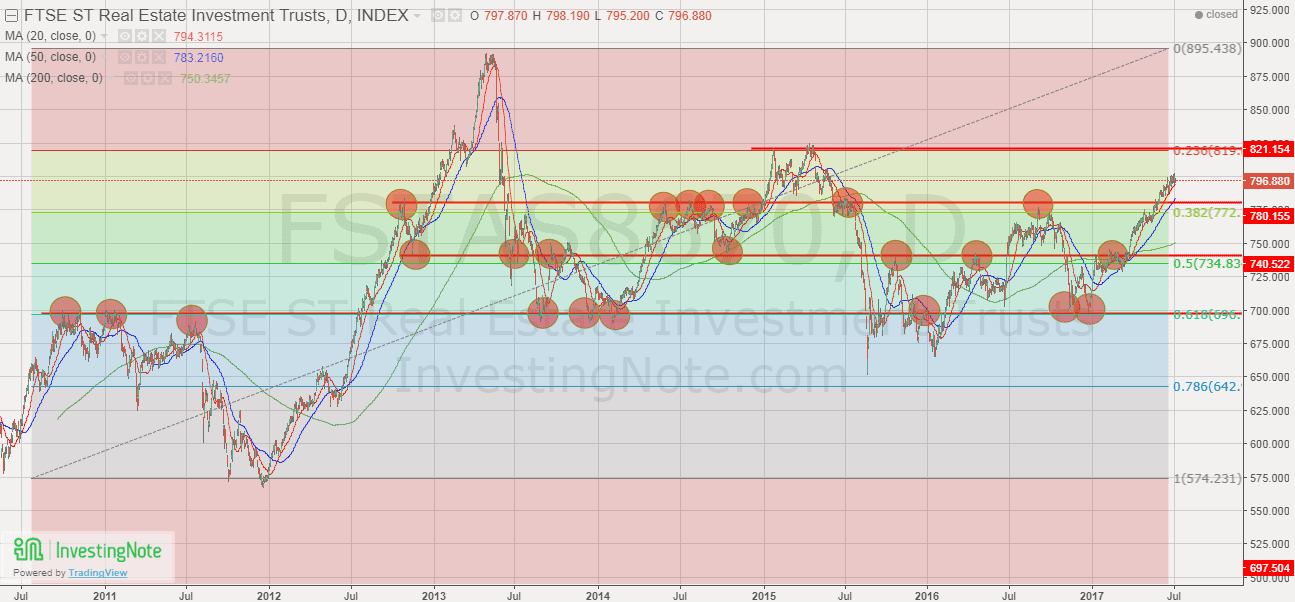
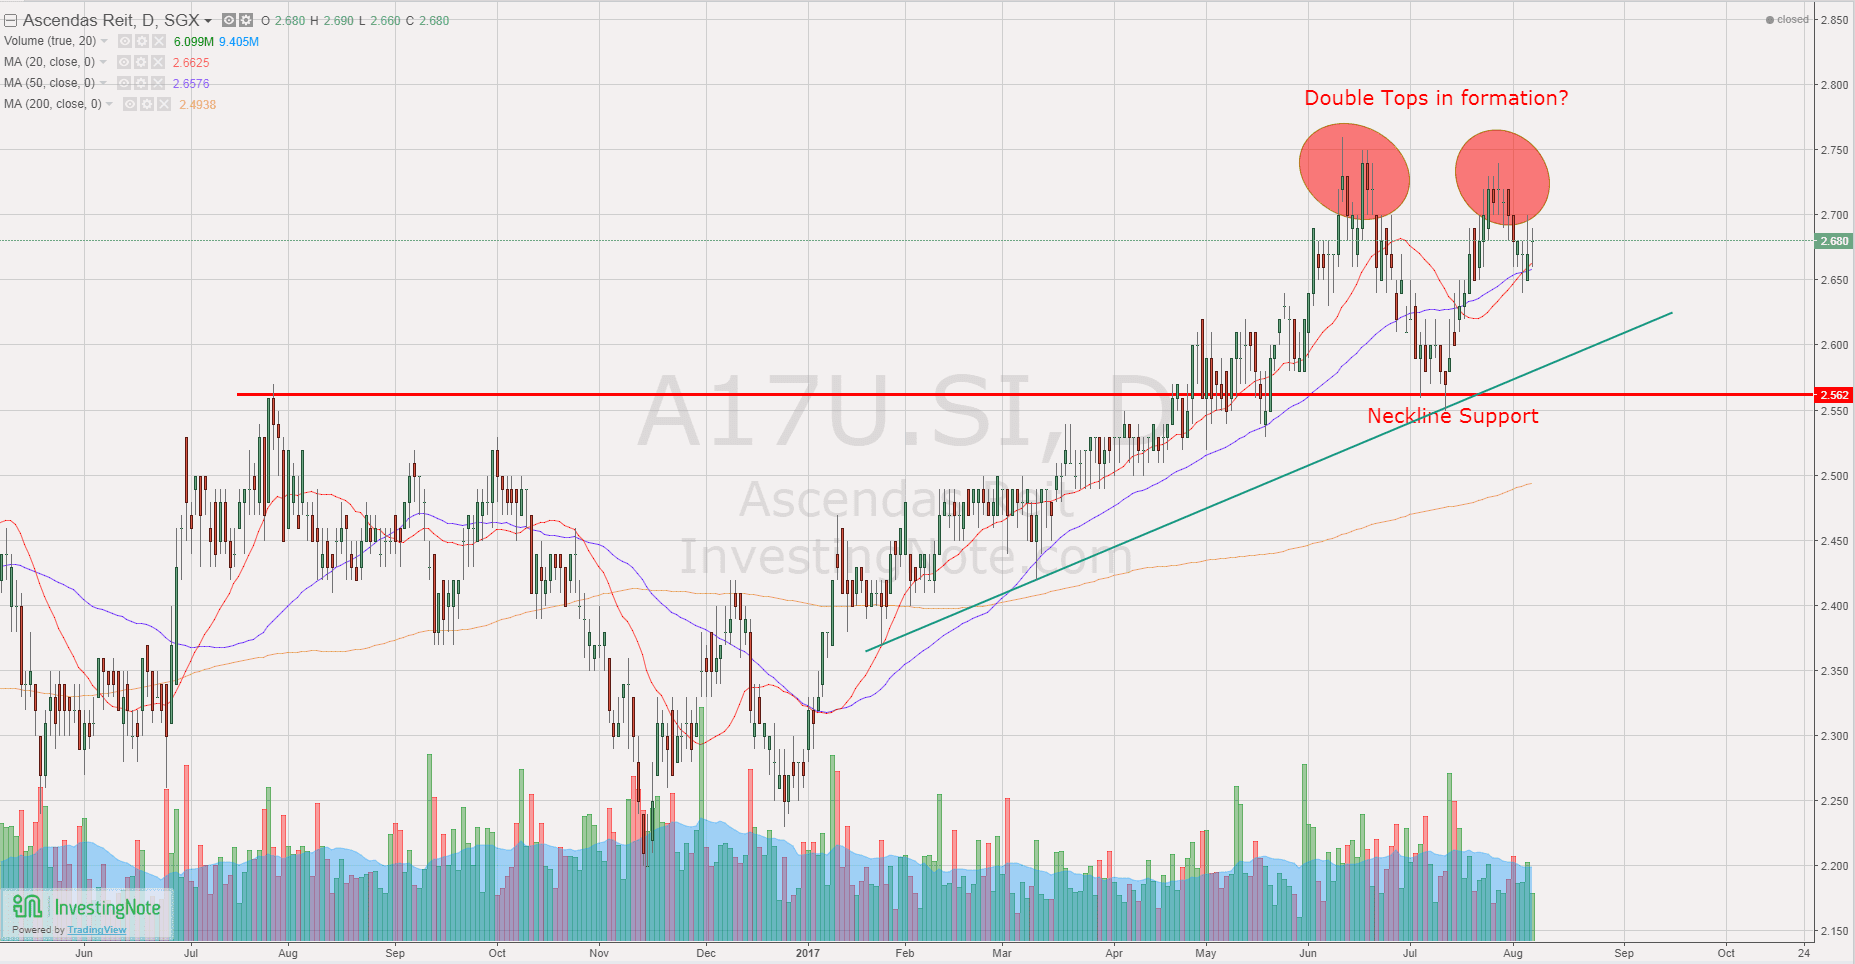
FTSE ST Real Estate Investment Trusts (FTSE ST REIT Index) increases from 796.88 to 802.25 (+0.67%) ( compare to last post on Singapore REIT Fundamental Comparison Table on July 9, 2017.  The index was rejected at a strong resistance is at about 820. See key level of support and resistances of FTSE REIT Index here.  Singapore REITs as a whole is still trading within a uptrend channel and still on a bullish up trend. However, keep a very close eye on the 20D / 50D SMA direction because Ascendas REIT is currently forming a Double Tops pattern.


Fundamental Analysis

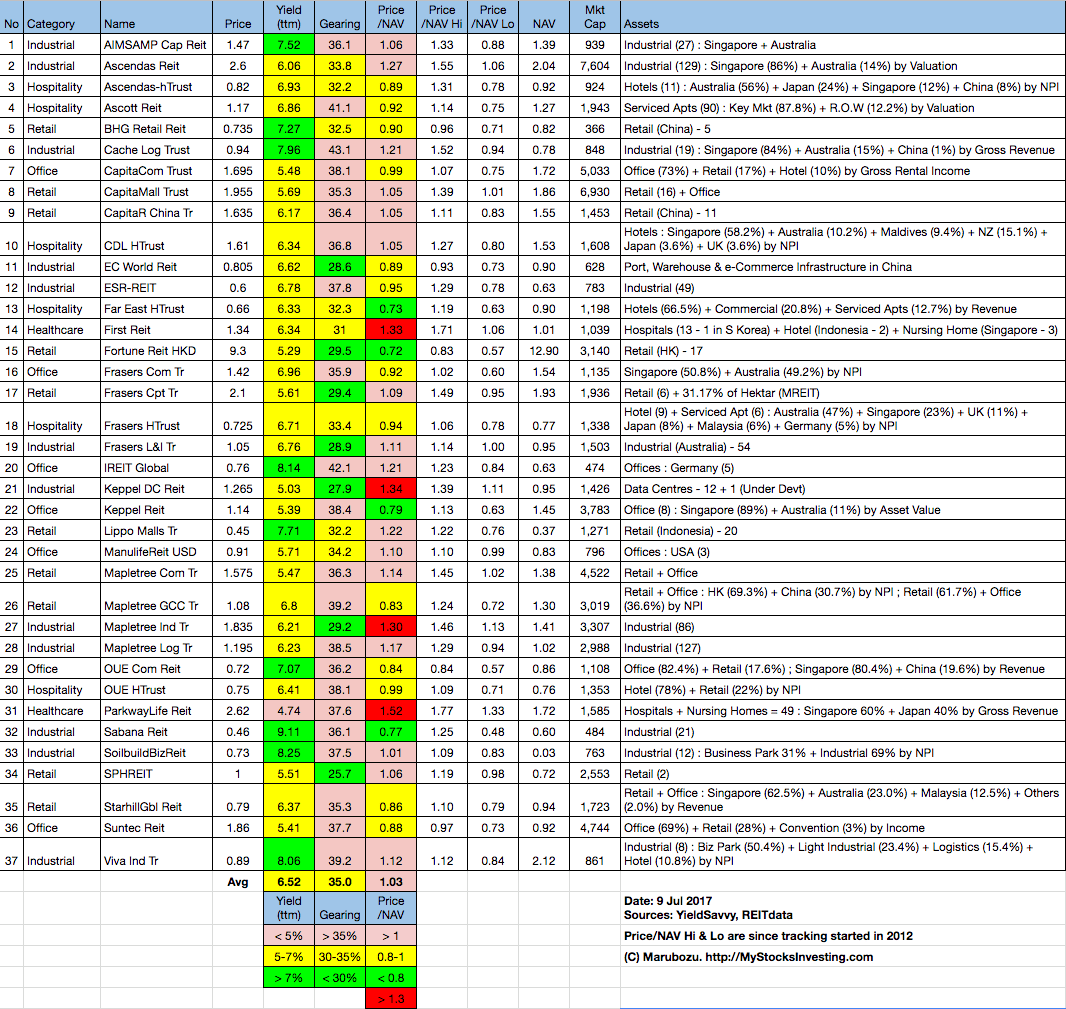
  • Price/NAV increases from 1.03 to 1.05 (Singapore Overall REIT sector is slightly over value now).
  • Distribution Yield decreases from 6.52% to 6,48% (take note that this is lagging number). About one quarter number of Singapore REITs (10 out of 37) have Distribution Yield > 7%. This is a significant drop in numbers compare to a few months ago. This indicates there are lesser Singapore REITs with attractive yield to pick now.
  • Gearing Ratio reduced from 35.0% to 34.8%. 20 out of 37 have Gearing Ratio more than 35%. In general, Singapore REITs sector gearing ratio is healthy.
  • Most overvalue REIT is Parkway Life (Price/NAV = 1.63), followed by Keppel DC REIT (Price/NAV = 1.37), First REIT (Price/NAV = 1.34), Mapletree Industrial Trust (Price/NAV = 1.32) and Ascendas REIT (Price/NAV = 1.31)
  • Most undervalue (base on NAV) is Fortune REIT (Price/NAV = 0.72),  followed by Far East HTrust (Price/NAV = 0.75),  Sabana REIT (Price/NAV = 0.79) and Keppel REIT (Price/NAV = 0.83).
  • Highest Distribution Yield (TTM) is Sabana REIT (8.47%), followed by SoilBuild BizREIT (8.4%), Viva Industrial Trust (7.88%) and iREIT Global REIT (7.89%).
  • Highest Gearing Ratio is Cache Logistic Trust (43.4%), iREIT Global (42.1%).

Disclaimer: The above table is best used for “screening and shortlisting only”. It is NOT for investing (Buy / Sell) decision. To learn how to use the table and make investing decision, Sign up next REIT Investing Seminar here to learn how to choose a fundamentally strong REIT for long term investing for passive income generation.


Economy Analysis – Singapore


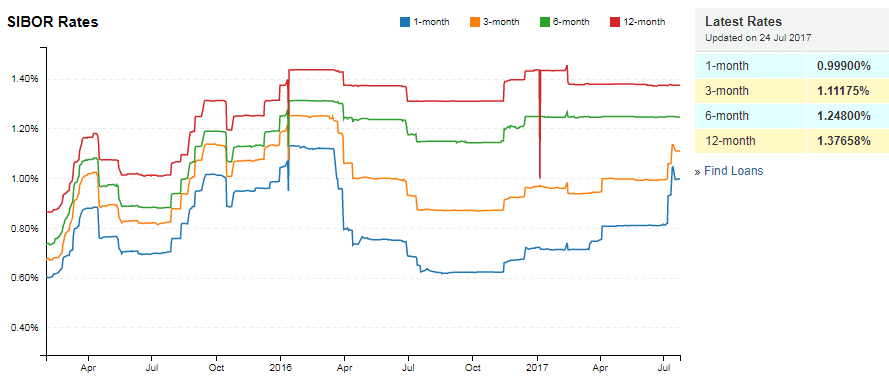
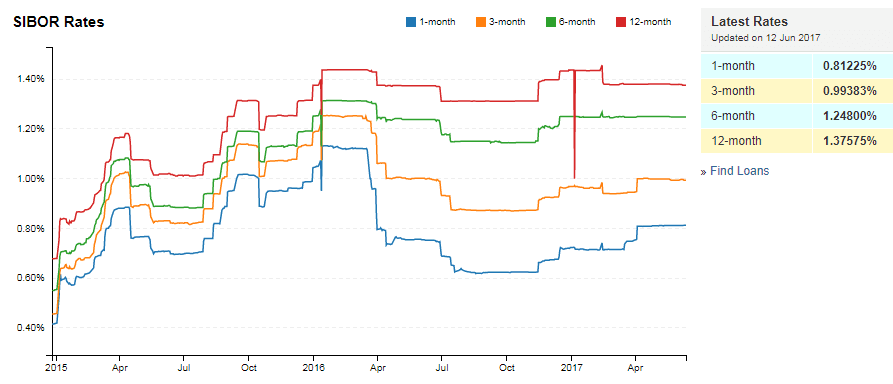
  • 1 month increases from  0.81225% to 0.99900%
  • 3 month increases from 0.99383% to 1.11175%
  • 6 month maintains at 1.24800%
  • 12 month increases from 1.37575% to 1.37658%


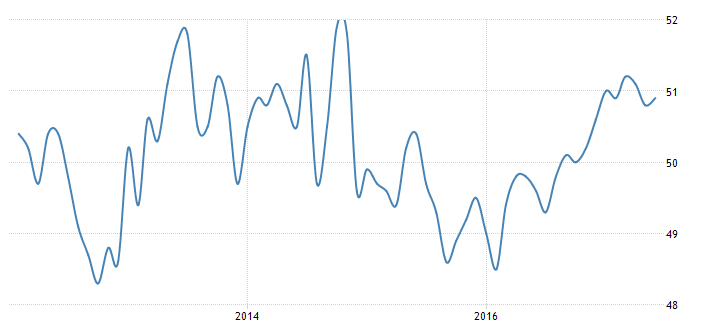
The Singapore Manufacturing PMI rose to 51 in July 2017 from 50.9 in the previous month. The reading pointed to the strongest pace of expansion in the manufacturing sector since April, boosted by growth in new orders, new exports and output. Also, the PMI for the electronics sector increased to 52.2 from 52.1 in June. Manufacturing PMI in Singapore averaged 50.14 from 2012 until 2017, reaching an all time high of 51.90 in October of 2014 and a record low of 48.30 in October of 2012.


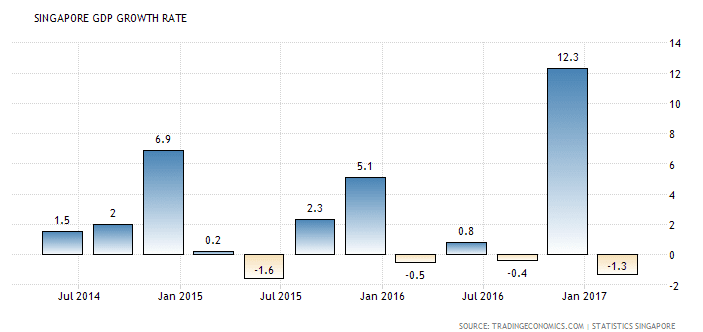
The Gross Domestic Product (GDP) in Singapore expanded 0.40 percent in the second quarter of 2017 over the previous quarter. GDP Growth Rate in Singapore averaged 6.77 percent from 1975 until 2017, reaching an all time high of 37.20 percent in the first quarter of 2010 and a record low of -13.50 percent in the fourth quarter of 2008.


Summary

Fundamentally the whole Singapore REITs is slightly over value. Office and Hospitality sectors are still undervalue but have not seen any clear turnaround signs yet. Technically Singapore REITs is still on bullish up trend but facing the resistance of 820.

There are not many REITs left to pick at the present moment. If you have missed the boat to invest in REITs but have fear of selecting the wrong REITs. you may want to check out this Investing in Singapore REIT course here.


See all other relevant  Singapore REITs blog posts here.

Original post from https://mystocksinvesting.com

Check out coming seminars at https://mystocksinvesting.com/events

REITs Portfolio Advisory


Continue ReadingSingapore REIT Fundamental Analysis Comparison Table – 7 August 2017

Singapore REIT Fundamental Analysis Comparison Table – 9 July 2017

  • Post author:

Technical Analysis

FTSE ST Real Estate Investment Trusts (FTSE ST REIT Index) increases from 788.29 to 796.88 (+1.09%) ( compare to last post on Singapore REIT Fundamental Comparison Table on June 4, 2017. The next strong resistance is at about 820. Singapore REITs as a whole is still on a bullish up trend.

See previous Singapore REITs Index Chart and Technical Analysis here.


Fundamental Analysis


  • Price/NAV increases from 1.02 to 1.03 (Singapore Overall REIT sector is slightly over value now).
  • Distribution Yield decreases from 6.67% to 6.52% (take note that this is lagging number). About one quarter number of Singapore REITs (9 out of 37) have Distribution Yield > 7%. This is a significant drop in numbers compare to a few months ago. This indicates there are lesser Singapore REITs with attractive yield to pick now.
  • Gearing Ratio maintains at 35.0%. 22 out of 37 have Gearing Ratio more than 35%. In general, Singapore REITs sector gearing ratio is healthy.
  • Most overvalue REIT is Parkway Life (Price/NAV = 1.52), followed by FIRST REIT (Price/NAV = 1.33) and Keppel DC REIT (Price/NAV = 1.34).
  • Most undervalue (base on NAV) is Fortune REIT (Price/NAV = 0.72),  followed by  Far East HTrust (Price/NAV = 0.73),  Sabana REIT (Price/NAV = 0.77),and Keppel REIT (Price/NAV = 0.79).
  • Highest Distribution Yield (TTM) is Sabana REIT (9.11%), followed by SoilBuild BizREIT (8.25%), Viva Industrial Trust (8.06%) and iREIT Global REIT (8.14%).
  • Highest Gearing Ratio is Cache Logistic Trust (43.1%), iREIT Global (42.1%) and Ascott REIT (41.1%)

Disclaimer: The above table is best used for “screening and shortlisting only”. It is NOT for investing (Buy / Sell) decision. To learn how to use the table and make investing decision, Sign up next REIT Investing Seminar here to learn how to choose a fundamentally strong REIT for long term investing for passive income generation.


Economy Analysis – Singapore

  • 1 month increases from 0.80850% to 0.81225%
  • 3 month decreases from  0.99925% to 0.99383%
  • 6 month decreases from  1.25000% to 1.24800%
  • 12 month decreases from 1.38125% to 1.37575%


The Singapore Manufacturing PMI increased to 50.9 in June of 2017 from 50.8 in the previous month. The reading pointed to the 10th straight month expansion in the factory activity, as new orders, new exports orders, inventory, output rose at a faster pace. In contrast, employment contracted further. Meanwhile, the PMI for electronics sector decreased to 52.1 from 52.4 in May. Manufacturing PMI in Singapore averaged 50.03 from 2012 until 2016, reaching an all time high of 51.90 in October of 2014 and a record low of 48.30 in October of 2012.


The Gross Domestic Product (GDP) in Singapore contracted 1.30 percent in the first quarter of 2017 over the previous quarter. GDP Growth Rate in Singapore averaged 6.81 percent from 1975 until 2017, reaching an all time high of 37.20 percent in the first quarter of 2010 and a record low of -13.50 percent in the fourth quarter of 2008.


Summary

Fundamentally the whole Singapore REITs is slightly over value. Big cap REITs do not move much last month while small cap REITs play the catch up. Price has moved a lot for most of the REITs and thus there is a significant drop in the distribution yield. Some of the big cap REITs are no longer cheap base on the valuation and yield.

Technically Singapore REITs is still on bullish up trend with the next resistance of 820. The future direction of Singapore REIT sector is very much dependent on the quarterly earning release in the next few weeks. The bullish momentum is expected to continue if most REITs meet or beat the distribution expectation.

There are not many REITs left to pick at the present moment. If you have missed the boat to invest in REITs but have fear of selecting the wrong REITs. you may want to check out this Investing in Singapore REIT course here.


See all other relevant  Singapore REITs blog posts here.

Original post from https://mystocksinvesting.com

Check out coming seminars at https://mystocksinvesting.com/events


Continue ReadingSingapore REIT Fundamental Analysis Comparison Table – 9 July 2017

Singapore REIT Fundamental Analysis Comparison Table – 4 June 2017

  • Post author:

FTSE ST Real Estate Investment Trusts (FTSE ST REIT Index) increases from 766.21 to 788.29 (+2.88%) ( compare to last post on Singapore REIT Fundamental Comparison Table on May 7, 2017. The index has broken out from the strong resistance at about 780. This is a very bullish signal for Singapore REITs as a whole.

See previous Singapore REITs Index Chart and Technical Analysis here.


  • Price/NAV increases from 0.99  to 1.02 (Singapore Overall REIT sector is at fair value now).
  • Distribution Yield decreases from 6.83% to 6.67% (take note that this is lagging number). Less than half of Singapore REITs (13 out of 37) have Distribution Yield > 7%. High yield REITs mainly from Hospitality Trust and small cap Industrial REIT, but we must understand the risks while chasing for the high yield. Check out How to spot those Fundamentally strong REIT with attractive yield to build up a Passive Income Portfolio?
  • Gearing Ratio decreases from  35.10% to 35.0%. 22 out of 37 have Gearing Ratio more than 35%. In general, Singapore REITs sector gearing ratio is healthy.
  • Most overvalue is Parkway Life (Price/NAV = 1.52), FIRST REIT (Price/NAV = 1.31) and Keppel DC REIT (Price/NAV = 1.35).
  • Most undervalue (base on NAV) is Sabana REIT (Price/NAV = 0.71), followed by  Far East HTrust (Price/NAV = 0.73), Fortune REIT (Price/NAV = 0.74) and Keppel REIT (Price/NAV = 0.78)
  • Highest Distribution Yield (TTM) is Sabana REIT (9.86%), followed by Viva Industrial Trust (8.59%), SoilBuild BizREIT (8.67%) and Cache Logistic Trust (8.51%). All 4 REITs are small cap from Industrial sector.
  • Highest Gearing Ratio is Cache Logistic Trust (43.1%), iREIT Global (42.1%) and Ascott REIT (41.1%)

Disclaimer: The above table is best used for “screening and shortlisting only”. It is NOT for investing (Buy / Sell) decision. To learn how to use the table and make investing decision, Sign up next REIT Investing Seminar here to learn how to choose a fundamentally strong REIT for long term investing for passive income generation.


Fundamentally the whole Singapore REITs is at its fair value in average. There are also sign of recovery in Office and Hospitality sectors where the quarterly DPU has started to increase again. See Office Sector Bubble Charts and Hospitality Sector Bubble Charts here.

Technically Singapore REITs is on bullish up trend and is expected to move higher after breaking out from the strong resistance last Friday.

I was invited by City Index to share Singapore REITs Market Outlook seminar on May 25, 2017 Sharing at TKP Conference Center, Raffles Place.  One of the most common questions asked is whether retail investors MISS THE BOAT in this REITs run up. My answer is YES base on the response from the audience because many retail investors are sitting on the sideline after reading all the gloomy economic news, over supply of properties in Singapore and fear of interest rate hikes. Most retail investors do not take any action due to fear but smart money already moved into Singapore REITs sector due to attractive valuation and distribution yield a few months ago.

I expect the bullish trend to continue in Singapore REITs but there are not many opportunities in big cap REITs as they have moved up too fast and some of the valuation / yield are no longer attractive. The next opportunities are probably in under value sectors and small cap REITs. However, it is important to pick the right one as some of the REITs have shown weakening fundamental. If you want to learn how to avoid choosing the wrong REITs, check out my next Singapore REITs training here.


Original post from https://mystocksinvesting.com

Check out coming seminars at https://mystocksinvesting.com/events

Continue ReadingSingapore REIT Fundamental Analysis Comparison Table – 4 June 2017