Good news to Singapore REIT supporters! This Singapore SGX APAC REIT ETF is a suggestible ETF in your investment portfolio for your retirement planning. A few advantages of investing in Singapore SGX APAC (ex-Japan) REIT ETF:
- Low cost as you can buy or sell using your local brokers.
- You can DIY (Do It Yourself)
- If you find too troublesome to do all the analysis of individual REIT.
- You can invest regularly using Dollar Cost Averaging method.
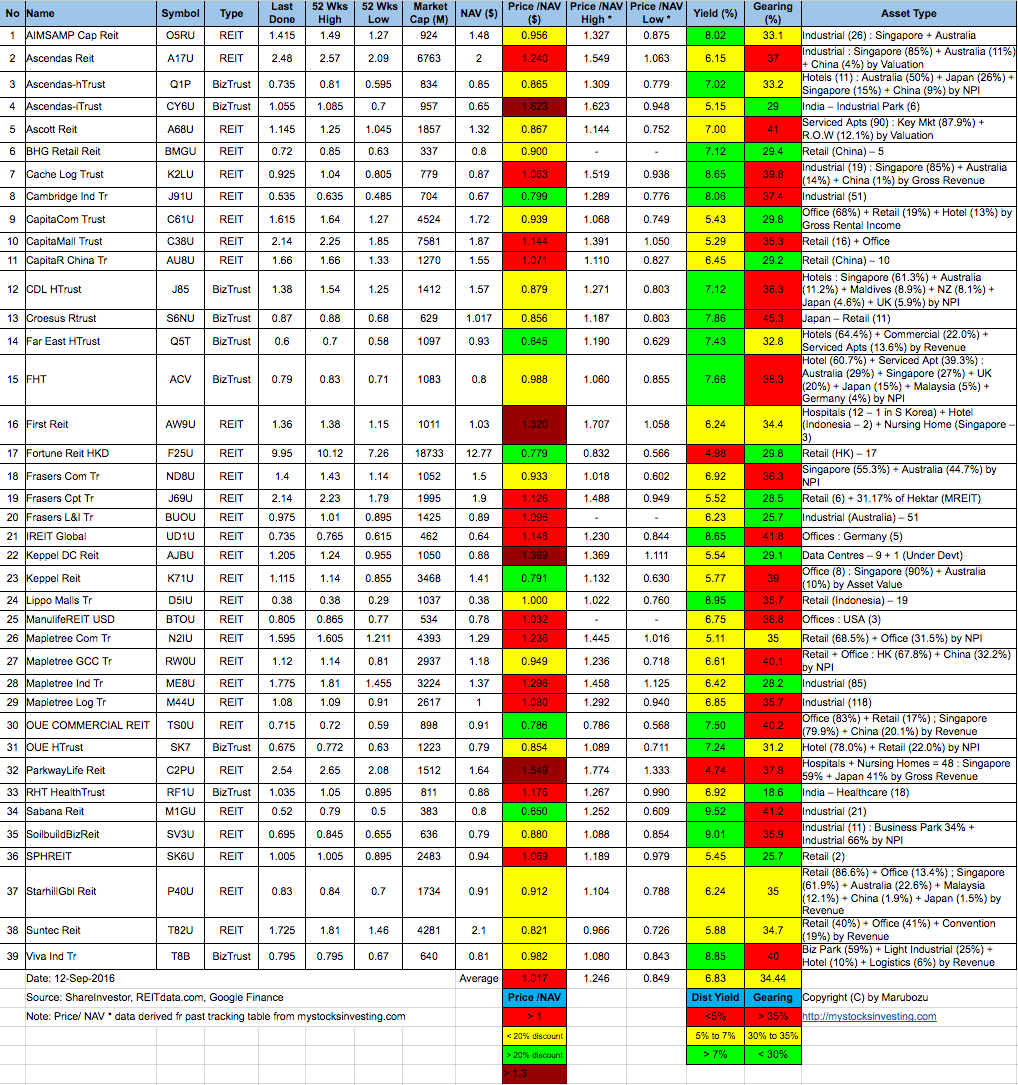
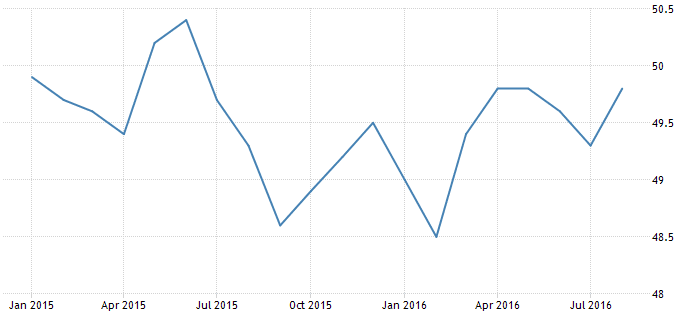
- Distribution Yield is about 4.5%. Not high but good enough to beat inflation and higher than bank interest rate. Check out other Singapore REITs here for higher distribution yield payout.
- Liquid. ie. you can buy and sell any time.
- Alternative ways to invest in Singapore and oversea properties if you are the property investor.
- Great Diversification into different type of properties, sectors, tenants, Forex, countries, etc.
Disclaimer: This is personal opinion. It is not a buy or sell recommendation.
You can read the announcement of the SGX news “SGX launches SGX APAC ex Japan Dividend Leaders REIT Index” here.
Singapore Exchange (SGX) today announced the launch of the SGX APAC ex Japan Dividend Leaders REIT Index, composed of 30 real estate investment trusts (REITs) across the Asia Pacific ex Japan region. It will be the first SGX index to be used as a benchmark index for a new exchange-traded fund (ETF), which will be issued by Phillip Capital Management (S) Limited (Phillip Capital Management), the asset management arm of Phillip Capital.
The index is the first of its kind, comprised entirely of REITs in the Asia Pacific region that are dividend weighted, whilst also becoming accessible through an ETF. The dividend-weighted index measures the performance of REITs that pay the largest dividends within the Asia Pacific ex Japan region, providing investors with the opportunity to participate in a portfolio offering significant and sustainable yields. The index’s total return over the twelve months to 29 July 2016 was 19.97%, demonstrating a yield over the same period of 4.53%.
Phillip Capital Management’s ETF, which will be listed on SGX, highlights the growing investor interest in ETFs in the region and attests to SGX’s status as the regional hub for REITs. The region’s ETF market is fast developing and poised for strong growth, with ETF assets in Asia expected to reach US$560 billion by 20211 .
Loh Boon Chye, CEO of SGX, said, “I am delighted with the launch of our first Pan-Asian index and that it will be used as a benchmark for an ETF. As SGX’s first truly regional index, it broadens our offering beyond the Singapore equity market, demonstrating our continued push to provide investors access to diverse opportunities. The demand for index-linked investment opportunities is increasing rapidly across Asia, and SGX is committed to supporting this growth through our comprehensive index services.”
Jeffrey Lee, MD and Co-CIO of Phillip Capital Management, said, “We are very excited to be working with SGX on producing a unique index where the underlying REIT constituents are weighted by total dividends paid in the preceding 12 months. The prospective ETF will offer investors transparent and low cost access to a diverse basket of quality REITs, many of which we have been investing in over the past decade through our actively-managed REIT funds. In view of the growing demand we see from our investors for sustainable income and the rise of passive investing, this is a highly opportune time to launch the first Asia Pacific REIT ETF comprising the region’s largest dividend-paying REITs.”
The SGX APAC ex Japan Dividend Leaders REIT Index captures over 70% of the region’s REIT universe by total capitalisation, taking into consideration size, free-float and liquidity. All constituent weights are capped at 10% to ensure greater portfolio diversification. The index was designed and built using SGX’s in-house index engineering expertise, in consultation with Phillip Capital Management.