How have Hospitality REITs in Singapore been faring during COVID-19?

  • Post author:

In Singapore, since the start of the COVID-19 pandemic, the Government has been using hotels and residences as quarantine and isolation facilities. This is to cushion the impact that COVID-19 has on the hospitality industry (which include Hospitality REITs). The small size of Singapore means that domestic tourism is almost non-existent. Occupancy rates have almost returned to pre COVID-19 levels since the end of Singapore’s partial lockdown back in Q2 2020 (also known as circuit breaker). This begs the question: 


Will Hospitality REITs post an uptick in distributions in Q2 2021, since occupancy has almost returned to pre-COVID levels due to increased Stay-Home Notices (SHNs), Quarantine Orders and staycations?


No. This is due to RevPAR and Average Room Rate (ARR) decreasing significantly.


The Singapore Government has been using hotels and residences as quarantine and isolation facilities. Although Marina Bay Sands (pictured) is not one of them.


Even though hospitality REITs’ occupancy has increased Year-on-Year (YoY) for Q1 due to government business (e.g. SHN at dedicated facilities) and domestic staycations, Hospitality REIT results in Q2 2021 are unlikely to return to pre-COVID levels.

Below are 2 Singapore REITs reporting lower RevPAR values, despite occupancy rates rising. Both have predominantly Singapore-based portfolios. The 2 REITs are:


  • CDL Hospitality Trusts (CDLHT). 66% of its portfolio value is in Singapore assets, consisting of 6 Hotels in Singapore. Its total portfolio valuation is S$2.597 billion.
  • Far East Hospitality Trust (FEHT). All of its 13 properties (9 Hotels and 4 Serviced Residences) are based in Singapore. Its total portfolio valuation is S$2.53 billion.


Q1 2021 vs Q1 2020 Year-on-Year Results Comparison


Below are slides taken from each REIT’s Q1 2021 results release, showing Occupancy, Average Room Rate (ARR or ADR) and RevPAR changes.


A slide taken from Far East Hospitality Trust’s quarterly results release, showing occupancy rate, ADR and RevPAR.

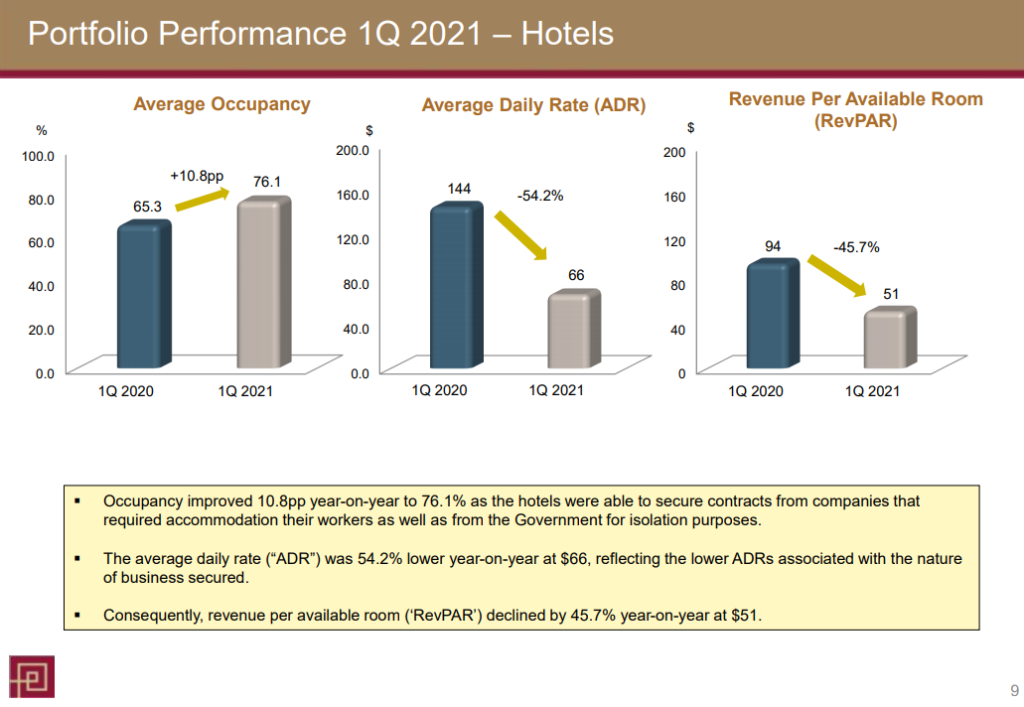
Comparing Q1 year-on-year results, despite a +10.8pp occupancy increase, Average Room Rate and RevPAR has decreased significantly (-54.2% and -45.7% respectively).

A slide taken from CDL Hospitality Trust’s quarterly results release, showing occupancy rate, ARR and RevPAR.


Comparing Q1 year-on-year results, despite a +15.9pp occupancy increase, Average Room Rate and RevPAR has decreased significantly (-49.2% and -34.3% respectively).

Due to the nature of business (rates offered during staycations, isolation facilities, rates for QOs and SHNs at dedicated facilities) being lower, it has resulted in lower Revenue Per Available Room (RevPAR) and Average Room Rate (ARR), despite increasing occupancy rates.

With almost-zero international travel demand, and similar supply levels, room rates are bound to drop. Eventually, when borders reopen, hospitality REIT distributions will rebound back to pre COVID-19 levels.

Below is the Q1 y-o-y comparison of the Net Property Income (NPI) for both REITs.


A slide taken from Far East Hospitality Trust’s quarterly results release showing Net Property Income.
A slide taken from CDL Hospitality Trust’s quarterly results release showing Net Property Income.


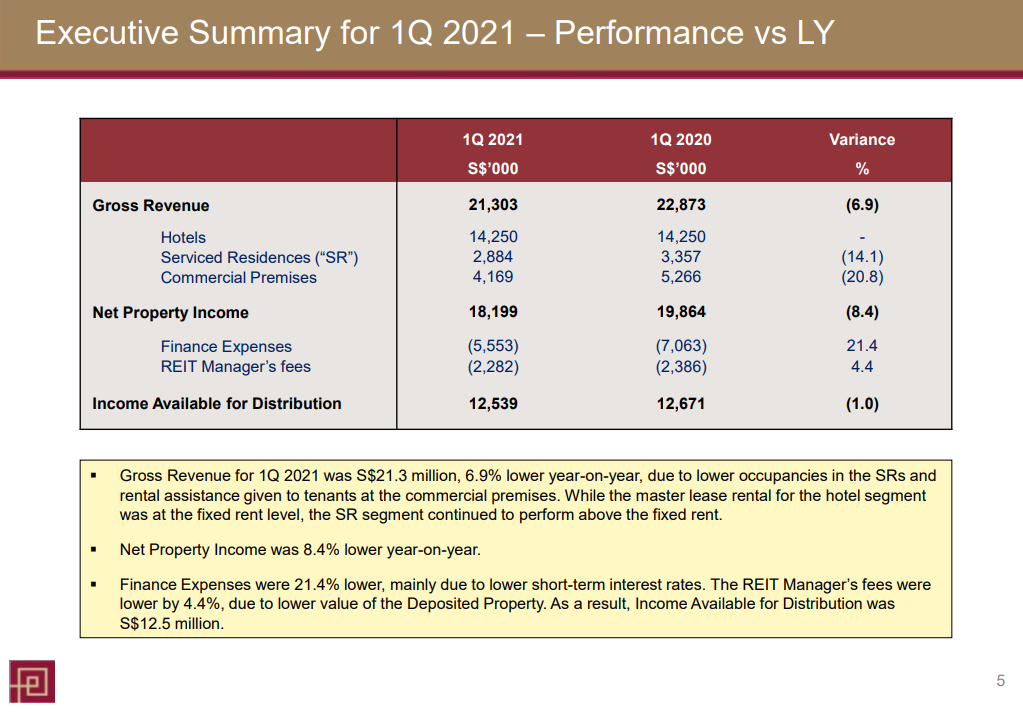
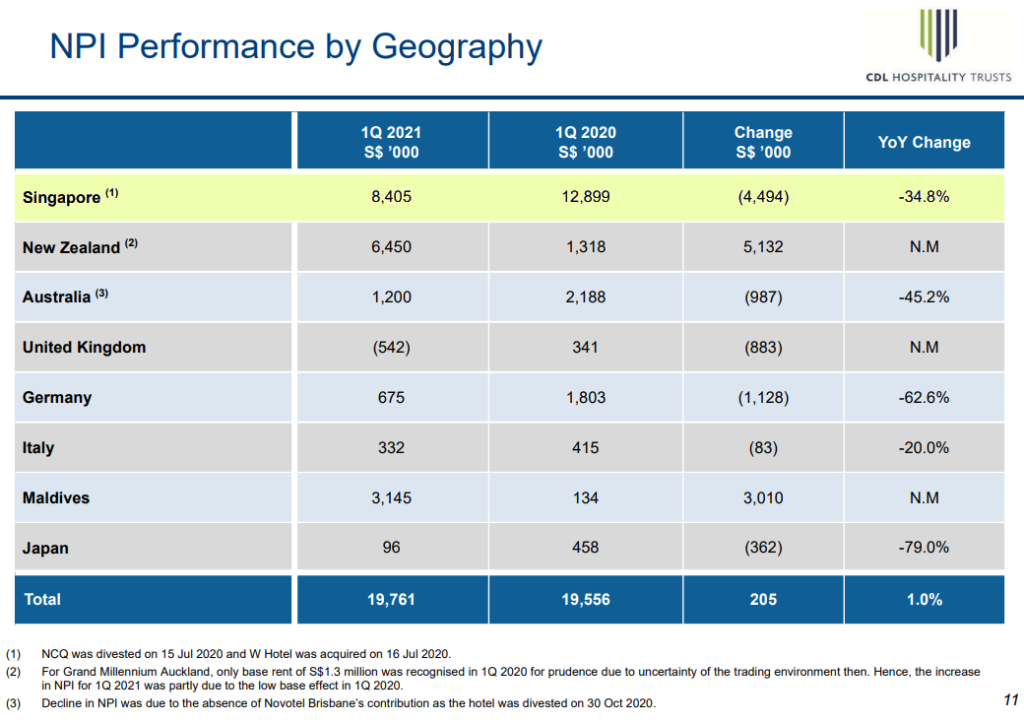
FEHT’s NPI has reported a -8.4% y-o-y change, and CDLHT’s NPI for Singapore properties reported a -34.8% y-o-y change. This is despite the +10.8pp and +15.9pp occupancy increase respectively in the same period.


2H 2020 vs 2H 2019 Year-on-Year Results Comparison


For further comparion between COVID times and pre-COVID times, delow are slides taken from each REIT’s FY 2020 results release. All comparisons will be made between 2H 2020 and 2H 2019, as Singapore did not experience a lockdown in 2H 2020.

Below are slides taken from each REIT’s FY 2020 results release, showing Occupancy, Average Room Rate (ARR or ADR) and RevPAR changes between 2H 2020 (during COVID) and 2H 2019 (pre-COVID).


A slide taken from Far East Hospitality Trust’s quarterly results release, showing occupancy rate, ADR and RevPAR.

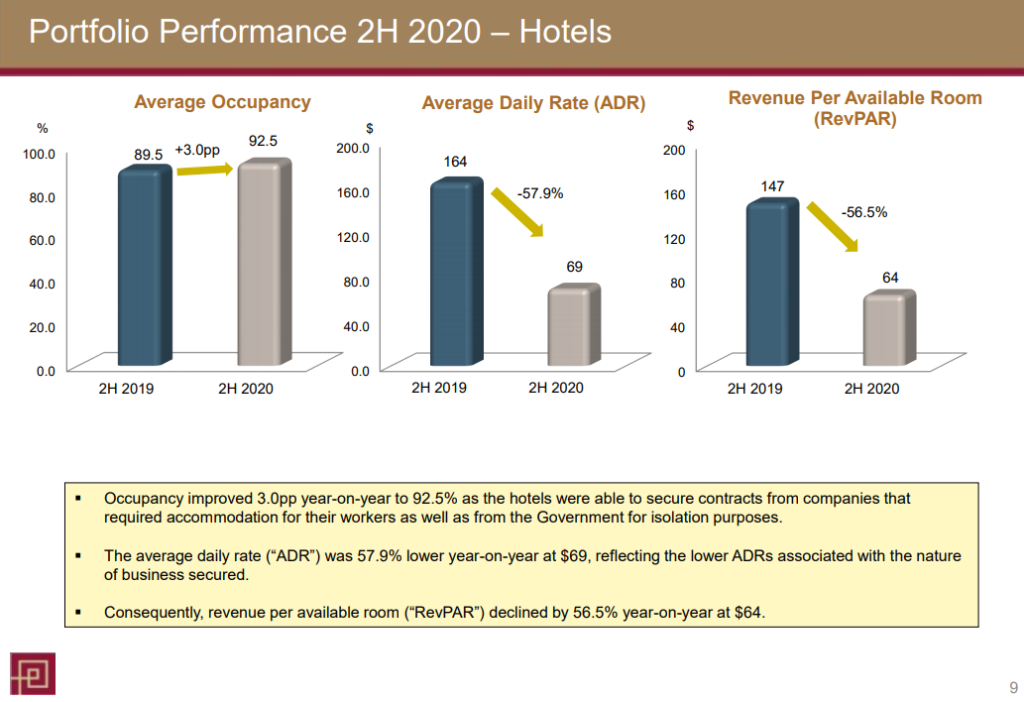
Compared to pre-COVID levels in 2H 2019, occupancy has increased by +3.0pp, yet ADR and RevPAR has decreased significantly (-57.9% and -56.5% respectively).

A slide taken from CDL Hospitality Trust’s quarterly results release, showing occupancy rate, ARR and RevPAR.


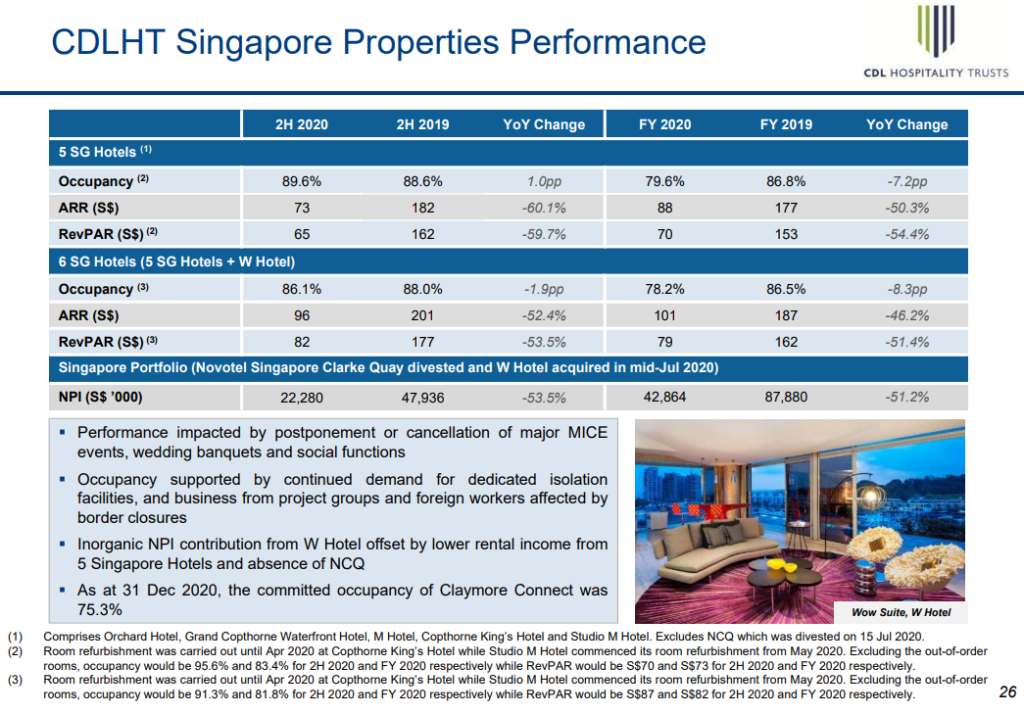
Similar to FEHT’s results, compared to pre-COVID levels in 2H 2019, occupancy has remained similar (small drop of -1.9pp), yet ARR and RevPAR has also decreased significantly (-52.4% and -53.5% respectively).

Below are the 2H 2020 vs 2H 2019 y-o-y comparison of the Net Property Income (NPI) for both REITs.


A slide taken from Far East Hospitality Trust’s quarterly results release showing Net Property Income.
A slide taken from CDL Hospitality Trust’s quarterly results release showing Net Property Income.


FEHT’s NPI has reported a -38.0% y-o-y change, and CDLHT’s NPI for Singapore properties reported a -53.5% y-o-y change for 2H 2020 compared to 2H 2019. This is despite minimal occupancy changes of +3.0pp and -1.9pp respectively in the same period.


Distribution History for both REITs


With all this in mind, and without any significant progress made in Q2 2021 in terms of reopening borders and resuming international travel, below are the DPU trends of each REIT. Data is taken from the StocksCafe REIT screener.


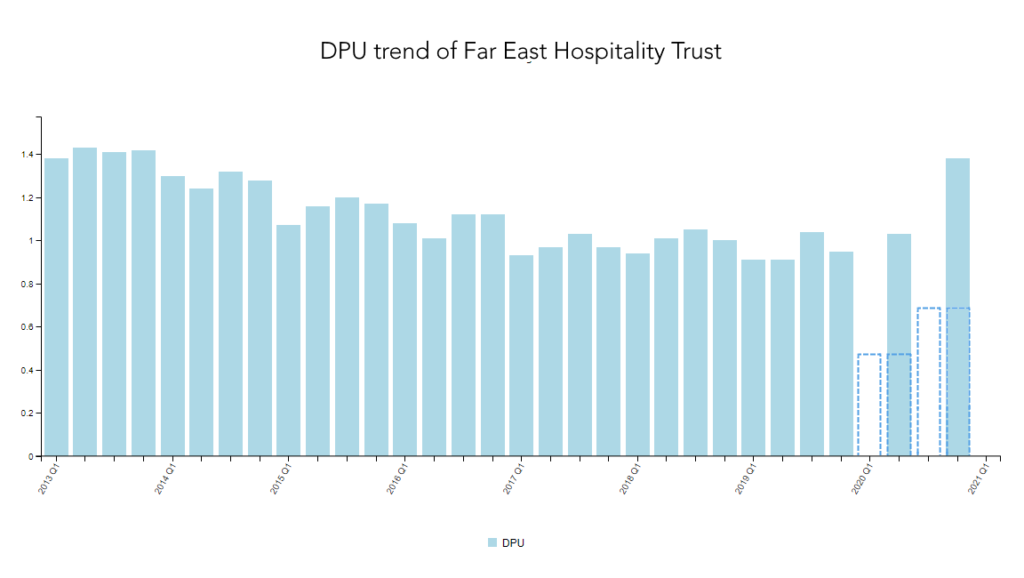
Even when the DPU graphs are interpolated to show quarterly distribution, the DPU for FEHT in 2H 2020 has not returned to normal levels, despite Singapore not undergoing a partial COVID lockdown during this period.


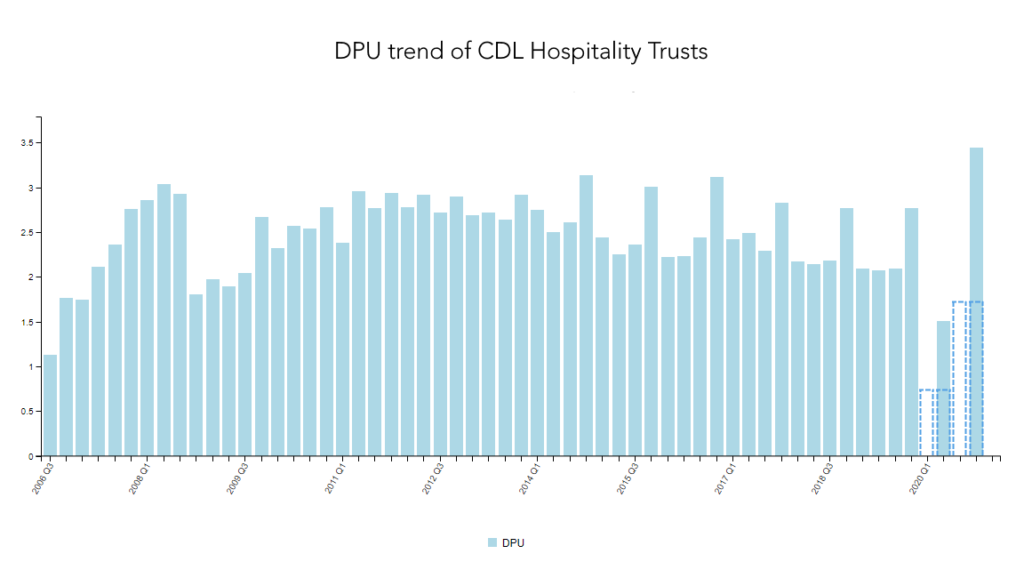
Similarly for CDLHT, the DPU for 2H 2020 has not returned to normal levels. This shows that despite high occupancy rates for Hospitality REITs, and government business in the form of SHNs and isolation facilities.

This is not to mention that in Q2 2021, Singapore went into another partial lockdown with gathering size limits of 2 (May 16 to June 13 2021), prompting cancellations of staycations with more than 2 guests per room as they were not allowed.

With all these in mind, even with government quarantine business (e.g. SHN), Hospitality REITs are unlikely to pose an uptick in distribution in Q2 2021.


Kenny Loh is a Senior Financial Advisory Manager and REITs Specialist of Singapore’s top Independent Financial Advisor. He helps clients construct diversified portfolios consisting of different asset classes from REITs, Equities, Bonds, ETFs, Unit Trusts, Private Equity, Alternative Investments and Fixed Maturity Funds to achieve an optimal risk adjusted return. Kenny is also a CERTIFIED FINANCIAL PLANNER, SGX Academy REIT Trainer, Certified IBF Trainer of Associate REIT Investment Advisor (ARIA) and also invited speaker of REITs Sympsosium and Invest Fair. 
 
You can join my Telegram channel #REITirement – SREIT Singapore REIT Market Update and Retirement related news. https://t.me/REITirement

Continue ReadingHow have Hospitality REITs in Singapore been faring during COVID-19?

Small-and-Medium Market Cap S-REITs top gainers of 1H 2021

  • Post author:

Halfway through the year, how has the S-REIT market performed in 1H 2021? Below is the table of the Top 10 gainers in S-REITs, sorted by order of ranking. This table is taken from the StocksCafe REIT screener.


Top 10 YTD performers. Data taken from the StocksCafe REIT screener.


Below are the charts of each of the Top 10 performers in the S-REIT market. The 10 S-REITs in this list gained an average of 23.09% YTD.


Charts of the Top 10 YTD S-REIT performers. Data taken from ShareInvestor.


Observations

  • Small and Medium Market Cap REITs outperformed Big Market Cap REITs.

With the exception of ParkwayLife REIT, 9 of the top 10 performing REITs have market capitalisations of $2.2B and below. The 10 S-REITs in this list gained an average of 23.09% YTD, while the 5 largest market cap REITs gained an average of only 1.67%See below for more charts.

  • Sector breakdown

Of the 10 REITs, 3 are Industrial REITS (AIMS APAC REIT, ARA LOGOS Log Trust and Sabana REIT), 1 is a hospitality REIT (ARA Hospitality Trust), 1 is a healthcare REIT (ParkwayLife REIT), 2 are Office/Retail REITs (Starhill Global REIT and Lendlease REIT), 1 is a retail REIT (Sasseur REIT), 1 is an office REIT (Keppel Pacific Oak REIT), and 1 is a diversified REIT (OUE Commercial REIT).

Below are the charts of each of the 5 largest market cap S-REITs, followed by a ‘heatmap’ chart Year-To-Date.


Charts of the 5 Largest Market Capitalisation S-REITs. Data taken from ShareInvestor.
 
A performance heatmap of the 39 S-REITs Year-To-Date. Data taken from the StocksCafe REIT screener


An interesting observation is that the 4 top performing S-REITs of 1H 2020 are only average performers for 1H 2021. Furthermore, generally poor-performing S-REITs in 1H 2020 performed well in 1H 2021.


Kenny Loh is a Senior Consultant and REITs Specialist of Singapore’s top Independent Financial Advisor. He helps clients construct diversified portfolios consisting of different asset classes from REITs, Equities, Bonds, ETFs, Unit Trusts, Private Equity, Alternative Investments, Digital Assets and Fixed Maturity Funds to achieve an optimal risk adjusted return. Kenny is also a CERTIFIED FINANCIAL PLANNER, SGX Academy REIT Trainer, Certified IBF Trainer of Associate REIT Investment Advisor (ARIA) and also invited speaker of REITs Symposium and Invest Fair.  

You can join my Telegram channel #REITirement – SREIT Singapore REIT Market Update and Retirement related news. https://t.me/REITirement

Continue ReadingSmall-and-Medium Market Cap S-REITs top gainers of 1H 2021

Singapore REIT Monthly Update (July 04 – 2021)

  • Post author:

Technical Analysis of FTSE ST REIT Index (FSTAS351020)

FTSE ST Real Estate Investment Trusts (FTSE ST REIT Index) increased slightly from 849.11 to 868.08 (2.23%) compared to the last month update. Currently the Singapore REIT index is still trading with a range between 816 and 880.

  • As for now, Short term direction: Sideway.
  • Immediate Support at 816, followed by 775.
  • Immediate Resistance at 880.

Previous chart on FTSE ST REIT index can be found in the last post: Singapore REIT Fundamental Comparison Table on June 6, 2021.

Fundamental Analysis of 39 Singapore REITs

The following is the compilation of 39 Singapore REITs with colour coding of the Distribution Yield, Gearing Ratio and Price to NAV Ratio.

  • Note 1: The Financial Ratio are based on past data and there are lagging indicators.
  • Note 2: This REIT table takes into account the dividend cuts due to the COVID-19 outbreak. Yield is calculated trailing twelve months (ttm), therefore REITs with delayed payouts might have lower displayed yields, thus yield displayed might be lower.
  • Note 3: All REITs have been updated with the latest Q1 2021 business updates.

(Source: https://stocks.cafe/kenny/advanced)

Do sign up for the REIT screener at only ~$8.33 per month! (limited time only). Normal price $120 per year.

  • Price/NAV increased to 1.06
    • Was 1.03 in June 2021.
    • Singapore Overall REIT sector is slightly overvalued now.
    • Take note that NAV is adjusted downward for most REITs due to drop in rental income (Property valuation is done using DCF model or comparative model)
  • TTM Distribution Yield decreased to 5.16%
    • Decreased from 5.32% in June 2021.
    • 8 of 38 (21%) Singapore REITs have distribution yields of above 7%.
    • Do take note that these yield numbers are based on current prices taking into account the delayed distribution/dividend cuts due to COVID-19, and post circuit breaker recovery.
    • Excluded Eagle Hospitality Trust due to suspension.
  • Gearing Ratio remained at 37.68%. 
    • Remained at 37.68% in June 2021.
    • Gearing Ratios are updated quarterly. No business updates have been made since the last monthly update.
    • In general, Singapore REITs sector gearing ratio is healthy but increased due to the reduction of the valuation of portfolios and an increase in borrowing due to Covid-19.
  • Most overvalued REITs (based on Price/NAV)
    • Parkway Life REIT (Price/NAV = 2.35)
    • Keppel DC REIT (Price/NAV = 2.08)
    • Mapletree Industrial Trust (Price/NAV = 1.69)
    • Mapletree Logistics Trust (Price/NAV = 1.57)
    • ARA LOGOS Logistics Trust (Price/NAV = 1.51)
    • No change in top 5 most overvalued REITs ranking since the June 2021 update.
  • Most undervalued REITs (based on Price/NAV)
    • First REIT (Price/NAV = 0.53)
    • Lippo Malls Indonesia Retail Trust (Price/NAV = 0.63)
    • BHG REIT (Price/NAV = 0.66)
    • Starhill Global REIT (Price/NAV = 0.72)
    • Suntec REIT (Price/NAV = 0.72)
    • Far East Hospitality Trust (Price/NAV = 0.73)
  • Highest Distribution Yield REITs (ttm)
    • First REIT (11.09%)
    • Prime US REIT (7.93%)
    • IREIT Global (7.80%)
    • Elite Commercial REIT (7.29%)
    • Sasseur REIT (7.26%)
    • Manulife US REIT (7.09%)
    • Reminder that these yield numbers are based on current prices taking into account delayed distribution/dividend cuts due to COVID-19.
    • Some REITs opted for semi-annual reporting and thus no quarterly DPU was announced.
  • Highest Gearing Ratio REITs
    • Eagle Hospitality Trust (65.5%) * Filed for Chapter 11 Bankruptcy Protection *
    • ARA Hospitality Trust (49.0%)
    • Suntec REIT (44.4%)
    • Elite Commercial REIT (42.1%)
    • ESR REIT (42.0%)
    • Lippo Malls Retail Trust (41.7%)
    • No business updates since the June 2021 update, thus no change in top 5 highest gearing ratio REITs ranking
  • Total Singapore REIT Market Capitalisation increased to S$108.4 Billion.
    • Decreased from S$106.1 Billion in June 2021.
  • Biggest Market Capitalisation REITs:
    • Capitaland Integrated Commercial Trust ($14.18B)
    • Ascendas REIT ($12.38B)
    • Mapletree Logistics Trust ($8.48B)
    • Mapletree Commercial Trust ($7.06B)
    • Mapletree Industrial Trust ($6.65B)
    • No change in ranking compared to March-May 2021 update.
  • Smallest Market Capitalisation REITs:
    • BHG Retail REIT ($284M)
    • United Hamsphire REIT ($327M)
    • ARA Hospitality Trust ($390M)
    • First REIT ($392M)
    • Sabana REIT ($442M)
    • All 5 REITs were also the Smallest Market Capitalisation REITs in the March-May 2021 update.
  • Eagle Hospitality Trust is currently suspended

Disclaimer: The above table is best used for “screening and shortlisting only”. It is NOT for investing (Buy / Sell) decision. To learn how to use the table and make appropriate investment decisions, sign up for the next REIT Investing Workshop here to learn how to choose fundamentally strong Singapore REITs for long-term investing and passive income generation.

Top 20 Performers of the Month (Source: https://stocks.cafe/kenny/advanced)

SG 10 Year & US 10 Year Government Bond Yield

  • SG 10 Year: 1.539%
  • US 10 Year: 1.446%

Summary

Fundamentally, the whole Singapore REITs landscape is slightly overvalued now based on the average Price/NAV value of the S-REITs. Below is the market cap heat map for the past 1 month. Small and mid cap REITs are the leaders in the performance.

(Source: https://stocks.cafe/kenny/overview)

Yield spread (in reference to 10 year Singapore government bond of 1.539%) continues to tighten from 3.8% to 3.62%. However, the risk premium is still attractive to accumulate Singapore REITs in stages to lock in the current price and to benefit from long-term yield after the recovery. Moving forward, it is expected that DPU will increase due to the recovery of global economy.

Technically the REIT Index is still trading in a sideways consolidation waiting for a breakout (upside bias). Current macro factors such as a low-interest rate environment, aggressive M&A for future DPU growth, wider roll out of the vaccination and recovery of global economic support the bullish breakout.

Note: This above analysis is for my own personal research and it is NOT a buy or sell recommendation. Investors who would like to leverage my extensive research and years of Singapore REIT investing experience can approach me separately for a REIT Portfolio Consultation.

Kenny Loh is a Senior Consultant and REITs Specialist of Singapore’s top Independent Financial Advisor. He helps clients construct diversified portfolios consisting of different asset classes from REITs, Equities, Bonds, ETFs, Unit Trusts, Private Equity, Alternative Investments, Digital Assets and Fixed Maturity Funds to achieve an optimal risk adjusted return. Kenny is also a CERTIFIED FINANCIAL PLANNER, SGX Academy REIT Trainer, Certified IBF Trainer of Associate REIT Investment Advisor (ARIA) and also invited speaker of REITs Symposium and Invest Fair.  You can join my Telegram channel #REITirement – SREIT Singapore REIT Market Update and Retirement related news. https://t.me/REITirement

Continue ReadingSingapore REIT Monthly Update (July 04 – 2021)