Halfway through the year, how has the S-REIT market performed in 1H 2021? Below is the table of the Top 10 gainers in S-REITs, sorted by order of ranking. This table is taken from the StocksCafe REIT screener.
Below are the charts of each of the Top 10 performers in the S-REIT market. The 10 S-REITs in this list gained an average of 23.09% YTD.
Charts of the Top 10 YTD S-REIT performers. Data taken from ShareInvestor.
Observations
Small and Medium Market Cap REITs outperformed Big Market Cap REITs.
With the exception of ParkwayLife REIT, 9 of the top 10 performing REITs have market capitalisations of $2.2B and below. The 10 S-REITs in this list gained an average of 23.09% YTD, while the 5 largest market cap REITs gained an average of only 1.67%. See below for more charts.
Sector breakdown
Of the 10 REITs, 3 are Industrial REITS (AIMS APAC REIT, ARA LOGOS Log Trust and Sabana REIT), 1 is a hospitality REIT (ARA Hospitality Trust), 1 is a healthcare REIT (ParkwayLife REIT), 2 are Office/Retail REITs (Starhill Global REIT and Lendlease REIT), 1 is a retail REIT (Sasseur REIT), 1 is an office REIT (Keppel Pacific Oak REIT), and 1 is a diversified REIT (OUE Commercial REIT).
Below are the charts of each of the 5 largest market cap S-REITs, followed by a ‘heatmap’ chart Year-To-Date.
Charts of the 5 Largest Market Capitalisation S-REITs. Data taken from ShareInvestor.A performance heatmap of the 39 S-REITs Year-To-Date. Data taken from the StocksCafe REIT screener
An interesting observation is that the 4 top performing S-REITs of 1H 2020 are only average performers for 1H 2021. Furthermore, generally poor-performing S-REITs in 1H 2020 performed well in 1H 2021.
Kenny Loh is a Senior Consultant and REITs Specialist of Singapore’s top Independent Financial Advisor. He helps clients construct diversified portfolios consisting of different asset classes from REITs, Equities, Bonds, ETFs, Unit Trusts, Private Equity, Alternative Investments, Digital Assets and Fixed Maturity Funds to achieve an optimal risk adjusted return. Kenny is also a CERTIFIED FINANCIAL PLANNER, SGX Academy REIT Trainer, Certified IBF Trainer of Associate REIT Investment Advisor (ARIA) and also invited speaker of REITs Symposium and Invest Fair.
Technical Analysis of FTSE ST REIT Index (FSTAS351020)
FTSE ST Real Estate Investment Trusts (FTSE ST REIT Index) increased slightly from 849.11 to 868.08 (2.23%) compared to the last month update. Currently the Singapore REIT index is still trading with a range between 816 and 880.
The following is the compilation of 39 Singapore REITs with colour coding of the Distribution Yield, Gearing Ratio and Price to NAV Ratio.
Note 1: The Financial Ratio are based on past data and there are lagging indicators.
Note 2: This REIT table takes into account the dividend cuts due to the COVID-19 outbreak. Yield is calculated trailing twelve months (ttm), therefore REITs with delayed payouts might have lower displayed yields, thus yield displayed might be lower.
Note 3: All REITs have been updated with the latest Q1 2021 business updates.
Do sign up for the REIT screener at only ~$8.33 per month! (limited time only). Normal price $120 per year.
Price/NAV increased to 1.06
Was 1.03 in June 2021.
Singapore Overall REIT sector is slightly overvalued now.
Take note that NAV is adjusted downward for most REITs due to drop in rental income (Property valuation is done using DCF model or comparative model)
TTM Distribution Yield decreased to 5.16%
Decreased from 5.32% in June 2021.
8 of 38 (21%) Singapore REITs have distribution yields of above 7%.
Do take note that these yield numbers are based on current prices taking into account the delayed distribution/dividend cuts due to COVID-19, and post circuit breaker recovery.
Excluded Eagle Hospitality Trust due to suspension.
Gearing Ratio remained at 37.68%.
Remained at 37.68% in June 2021.
Gearing Ratios are updated quarterly. No business updates have been made since the last monthly update.
In general, Singapore REITs sector gearing ratio is healthy but increased due to the reduction of the valuation of portfolios and an increase in borrowing due to Covid-19.
Most overvalued REITs (based on Price/NAV)
Parkway Life REIT (Price/NAV = 2.35)
Keppel DC REIT (Price/NAV = 2.08)
Mapletree Industrial Trust (Price/NAV = 1.69)
Mapletree Logistics Trust (Price/NAV = 1.57)
ARA LOGOS Logistics Trust (Price/NAV = 1.51)
No change in top 5 most overvalued REITs ranking since the June 2021 update.
Most undervalued REITs (based on Price/NAV)
First REIT (Price/NAV = 0.53)
Lippo Malls Indonesia Retail Trust (Price/NAV = 0.63)
BHG REIT (Price/NAV = 0.66)
Starhill Global REIT (Price/NAV = 0.72)
Suntec REIT (Price/NAV = 0.72)
Far East Hospitality Trust (Price/NAV = 0.73)
Highest Distribution Yield REITs (ttm)
First REIT (11.09%)
Prime US REIT (7.93%)
IREIT Global (7.80%)
Elite Commercial REIT (7.29%)
Sasseur REIT (7.26%)
Manulife US REIT (7.09%)
Reminder that these yield numbers are based on current prices taking into account delayed distribution/dividend cuts due to COVID-19.
Some REITs opted for semi-annual reporting and thus no quarterly DPU was announced.
No business updates since the June 2021 update, thus no change in top 5 highest gearing ratio REITs ranking
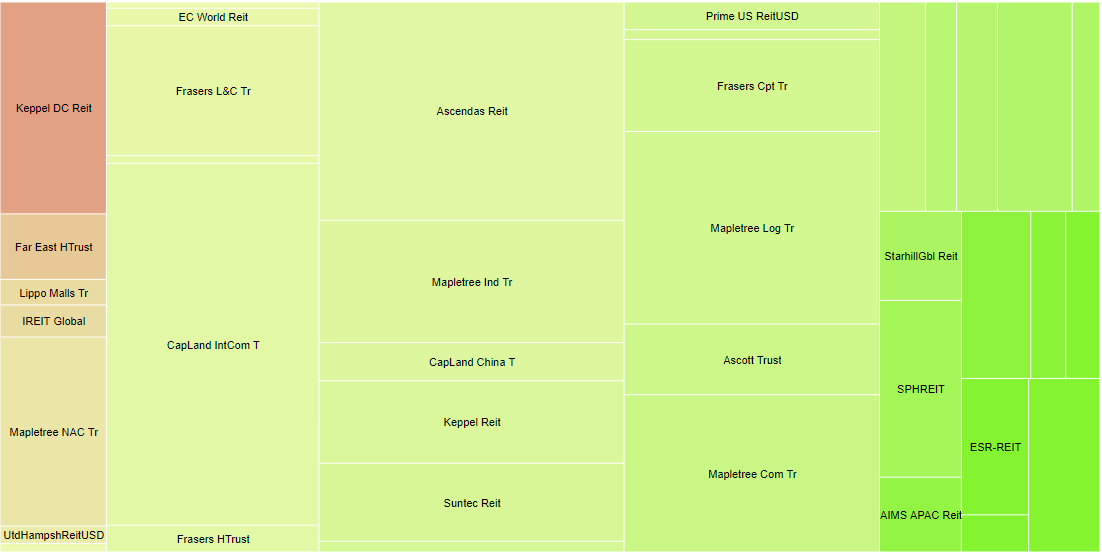
Total Singapore REIT Market Capitalisation increased to S$108.4 Billion.
Decreased from S$106.1 Billion in June 2021.
Biggest Market Capitalisation REITs:
Capitaland Integrated Commercial Trust ($14.18B)
Ascendas REIT ($12.38B)
Mapletree Logistics Trust ($8.48B)
Mapletree Commercial Trust ($7.06B)
Mapletree Industrial Trust ($6.65B)
No change in ranking compared to March-May 2021 update.
Smallest Market Capitalisation REITs:
BHG Retail REIT ($284M)
United Hamsphire REIT ($327M)
ARA Hospitality Trust ($390M)
First REIT ($392M)
Sabana REIT ($442M)
All 5 REITs were also the Smallest Market Capitalisation REITs in the March-May 2021 update.
Eagle Hospitality Trust is currently suspended
Disclaimer: The above table is best used for “screening and shortlisting only”. It is NOT for investing (Buy / Sell) decision. To learn how to use the table and make appropriate investment decisions, sign up for the next REIT Investing Workshop here to learn how to choose fundamentally strong Singapore REITs for long-term investing and passive income generation.
Fundamentally, the whole Singapore REITs landscape is slightly overvalued now based on the average Price/NAV value of the S-REITs. Below is the market cap heat map for the past 1 month. Small and mid cap REITs are the leaders in the performance.
Yield spread (in reference to 10 year Singapore government bond of 1.539%) continues to tighten from 3.8% to 3.62%. However, the risk premium is still attractive to accumulate Singapore REITs in stages to lock in the current price and to benefit from long-term yield after the recovery. Moving forward, it is expected that DPU will increase due to the recovery of global economy.
Technically the REIT Index is still trading in a sideways consolidation waiting for a breakout (upside bias). Current macro factors such as a low-interest rate environment, aggressive M&A for future DPU growth, wider roll out of the vaccination and recovery of global economic support the bullish breakout.
Note: This above analysis is for my own personal research and it is NOT a buy or sell recommendation. Investors who would like to leverage my extensive research and years of Singapore REIT investing experience can approach me separately for a REIT Portfolio Consultation.
Kenny Loh is a Senior Consultant and REITs Specialist of Singapore’s top Independent Financial Advisor. He helps clients construct diversified portfolios consisting of different asset classes from REITs, Equities, Bonds, ETFs, Unit Trusts, Private Equity, Alternative Investments, Digital Assets and Fixed Maturity Funds to achieve an optimal risk adjusted return. Kenny is also a CERTIFIED FINANCIAL PLANNER, SGX Academy REIT Trainer, Certified IBF Trainer of Associate REIT Investment Advisor (ARIA) and also invited speaker of REITs Symposium and Invest Fair. You can join my Telegram channel #REITirement – SREIT Singapore REIT Market Update and Retirement related news. https://t.me/REITirement
On Money and Me, Michelle Martin is joined by Kenny Loh, REIT Specialist and Independent Financial Advisor to discuss an overview of the REIT performance to date, some of the best performing and worst performing REITs, and City Developments Limited application for an initial public offering of a real estate investment trust with commercial assets located in Britain.
Effect of COVID-19 measures relaxing on S-REITs
Best and worst performing S-REITs
CDL filing for a Singapore REIT IPO on London commercial assets
Listen to his previous market outlook interviews here:
Kenny Loh is a Senior Consultant and REITs Specialist of Singapore’s top Independent Financial Advisor. He helps clients construct diversified portfolios consisting of different asset classes from REITs, Equities, Bonds, ETFs, Unit Trusts, Private Equity, Alternative Investments and Fixed Maturity Funds to achieve an optimal risk adjusted return. Kenny is also a CERTIFIED FINANCIAL PLANNER, SGX Academy REIT Trainer, Certified IBF Trainer of Associate REIT Investment Advisor (ARIA) and also invited speaker of REITs Sympsosium and Invest Fair.