Singapore REIT Monthly Update (Mar 04 – 2021)
Technical Analysis of FTSE ST REIT Index (FSTAS8670)
FTSE ST Real Estate Investment Trusts (FTSE ST REIT Index) decreased from 877.59 to 826.65 (-5.80%) compared to last month update. Currently the Singapore REIT index is moving sideway after a false breakout at the resistance of 874.
- As for now, Short term direction: Sideway.
- Immediate Support at 825, followed by 775.
- Immediate Resistance at 874.

Previous chart on FTSE ST REIT index can be found in the last post Singapore REIT Fundamental Comparison Table on Jan 24, 2021.
Fundamental Analysis of 40 Singapore REITs
The following is the compilation of 40 Singapore REITs with colour coding of the Distribution Yield, Gearing Ratio and Price to NAV Ratio.
- Note 1: The Financial Ratio are based on past data and there are lagging indicators.
- Note 2: This REIT table takes into account the dividend cuts due to COVID-19 outbreak. Yield is calculated trailing twelve months (ttm), therefore REITs with delayed payouts might have lower displayed yields, thus yield displayed might be lower.
- Note 3: REITs highlighted in blue have been updated with the latest the Q4 2020 business updates.
(Source: https://stocks.cafe/kenny/advanced)
Do sign up for the REIT screener at only ~$8.33 per month! (limited time only). Normal price $120 per year.

- Price/NAV decreased at 0.98
- Decreased from 1.01 in January 2021
- Singapore Overall REIT sector is at about fair value now
- Take note that NAV is adjusted downward for most REITs due to drop in rental income (Property valuation is done using DCF model or comparative model)
- TTM Distribution Yield increased to 5.68%
- Increased from 5.45% in January 2021
- One Third of Singapore REITs (13 out of 39) have distribution yields of above 7%.
- Do take note that these yield numbers are based on current prices taking into account the delayed distribution/dividend cuts due to COVID-19, and post circuit breaker recovery.
- Exclude Eagle Hospitality Trust due to suspension.
- Gearing Ratio at 37.44%.
- Reduce from 38.19% in January 2021.
- In general, Singapore REITs sector gearing ratio is healthy but started to increase due to the reduction of the valuation of portfolios and increase in borrowing.
- Most overvalued REITs (based on Price/NAV)
- Keppel DC REIT (Price/NAV = 2.28)
- Parkway Life (Price/NAV = 2.09)
- Mapletree Industrial Trust (Price/NAV = 1.55)
- Mapletree Logistics Trust (Price/NAV = 1.45)
- Ascendas REIT (Price/NAV = 1.34)
- No change from January 2021 for top 5 overvalued REITs ranking
- Most undervalued REITs (based on Price/NAV)
- Lippo Malls Indonesia Retail Trust (Price/NAV = 0.36)
- First REIT (Price/NAV = 0.42)
- OUE Commercial REIT (Price/NAV = 0.63)
- Starhill Global REIT (Price/NAV = 0.64)
- BHG REIT (Price/NAV = 0.67)
- Sabana REIT (Price/NAV =0.73)
- Suntec REIT (Price/NAV = 0.73)
- Highest Distribution Yield REITs (ttm)
- First REIT (19.76%)
- KepPacOak US REIT (9.16%)
- Prime US REIT (8.73%)
- Manulife REIT (8.42%)
- Sasseur REIT (7.65%)
- Reminder that these yield numbers are based on current prices taking into account delayed distribution/dividend cuts due to COVID-19.
- Some REITs opted for semi-annual reporting and thus no quarterly DPU was announced.
- Highest Gearing Ratio REITs
- Eagle Hospitality Trust (65.5%) * Filed for Chapter 11 Bankruptcy Protection *
- First REIT (49%)
- ARA Hospitality Trust (48.2%)
- Suntec REIT (44.3%)
- Lippo Malls Retail Trust (42.4%)
- ESR REIT (41.6%)
- Mapletree NAC Trust (41.3%)
- OUE Commercial REIT (41.2%)
- Total Singapore REIT Market Capitalisation = S$104.9 Billion.
- Decreased from S$107.2 Billion in January 2021.
- Biggest Market Capitalisation REITs:
- Capitaland Integrated Commercial Trust ($13.91B)
- Ascendas REIT ($11.64B)
- Mapletree Logistics Trust ($8.48B)
- Mapletree Commercial Trust ($6.73B)
- Mapletree Industrial Trust ($6.70B)
- Smallest Market Capitalisation REITs:
- BHG Retail REIT ($296M)
- United Hamsphire REIT ($327M)
- First REIT ($328M)
- ARA Hospitality Trust ($380M)
- Sabana REIT ($400M)
- Eagle Hospitality Trust is currently suspended
Disclaimer: The above table is best used for “screening and shortlisting only”. It is NOT for investing (Buy / Sell) decision. To learn how to use the table and make investing decision, Sign up next REIT Investing Workshop here to learn how to choose a fundamentally strong Singapore REIT for long term investing for passive income generation.
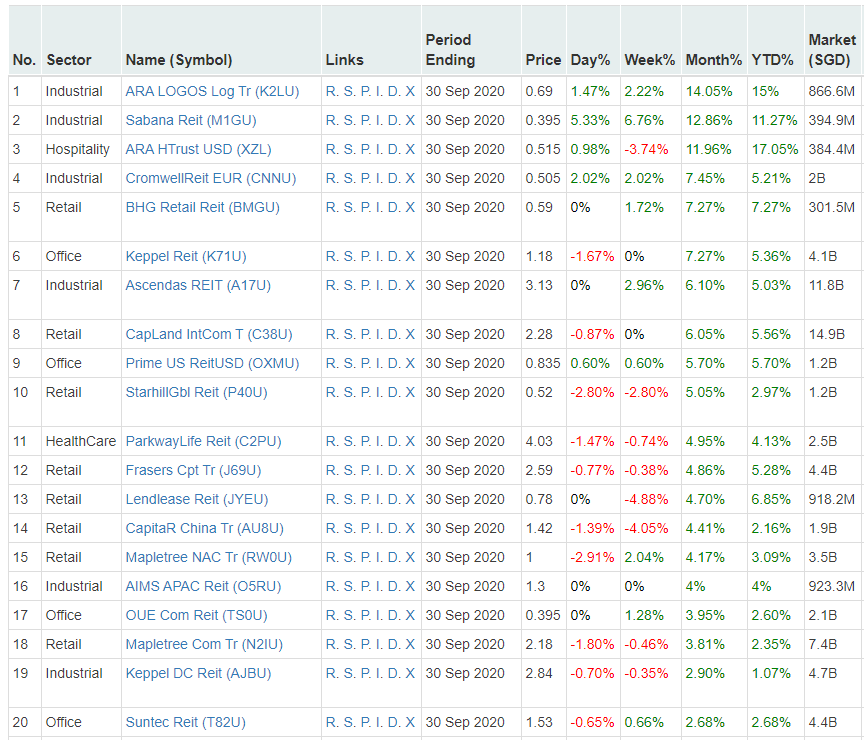
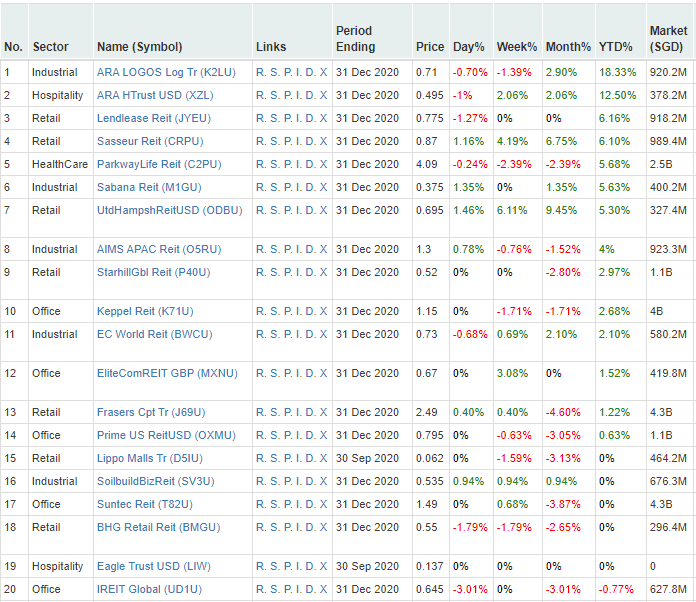
Top 20 Performers of the Month (Source: https://stocks.cafe/kenny/advanced)
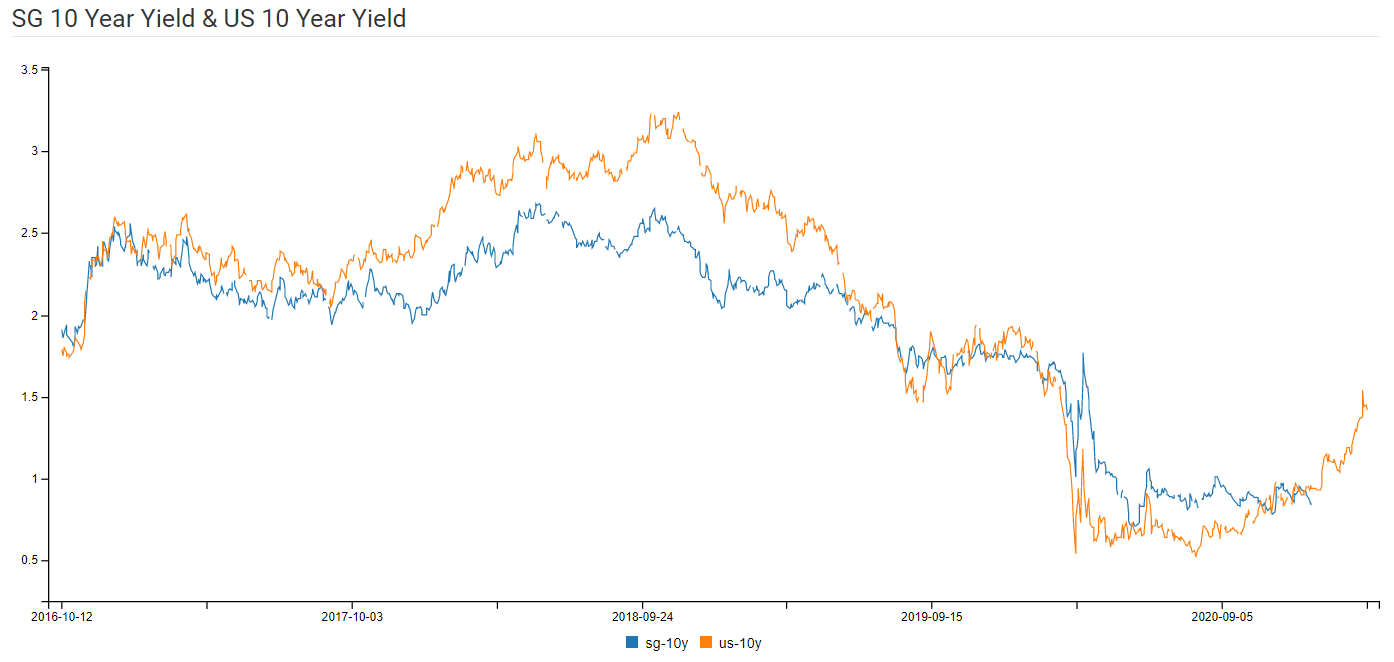
SG 10 Year & US 10 Year Government Bond Yield
- SG 10 Year: 1.391%
- US 10 Year: 1.45%
Summary
Fundamentally the whole Singapore REITs is close to fair value now based on simple average on the Price/NAV. Below is the market cap heat map for the past 1 month. In general, the Singapore REITs sector is going through a correction now caused by a spike in 10 Years US Treasury Bond Yield due to the fear of inflation. However, I think it is still too early to talk about inflation now as the world is still at the early economy recovery phase. This is probably a knee jerk reaction to let go some weak investors. This correction presents another entry opportunities for investors who miss out the entry during the market crash in Mar-May 2020. Next US FOMC meeting is on Mar 17, 2021 and it is 95.2% probability the US fed will keep the current low interest rate.

(Source: https://stocks.cafe/kenny/overview)
Yield spread (reference to 10 year Singapore government bond of 1.391%) tighten from 4.449% to 4.289% . However, the risk premium are still attractive to accumulate Singapore REITs in stages to lock in the current price and long term yield after the recovery. Moving forward, it is expected the increase of DPU due to the recovery of global economy.
Technically the REIT Index is currently trading in a sideway consolidation after the false breakout. However, current macro factors such as low interest rate environment, aggressive M&A for future DPU growth and recovery of global economic support the bullish breakout.
Note: This above analysis is for my own personal research and it is NOT a buy or sell recommendation. Investors who would like to leverage on my extensive research and years on Singapore REIT investing experience can approach me separately for REIT Portfolio Consultation.
Kenny Loh is a Senior Consultant and REITs Specialist of Singapore’s top Independent Financial Advisor. He helps clients construct diversified portfolios consisting of different asset classes from REITs, Equities, Bonds, ETFs, Unit Trusts, Private Equity, Alternative Investments and Fixed Maturity Funds to achieve an optimal risk adjusted return. Kenny is also a CERTIFIED FINANCIAL PLANNER, SGX Academy REIT Trainer, Certified IBF Trainer of Associate REIT Investment Advisor (ARIA) and also invited speaker of REITs Symposium and Invest Fair. You can join my Telegram channel #REITirement – SREIT Singapore REIT Market Update and Retirement related news. https://t.me/REITirement