MoneyFM 89.3: Money and Me: The REIT Space
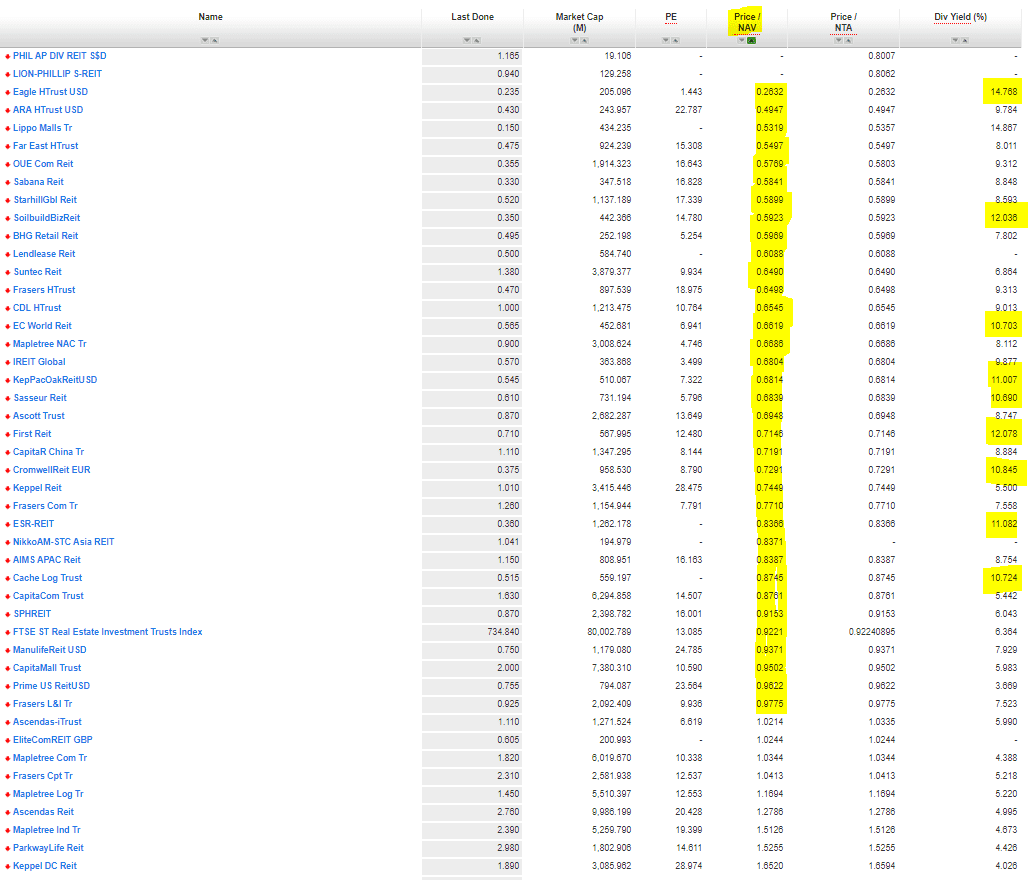
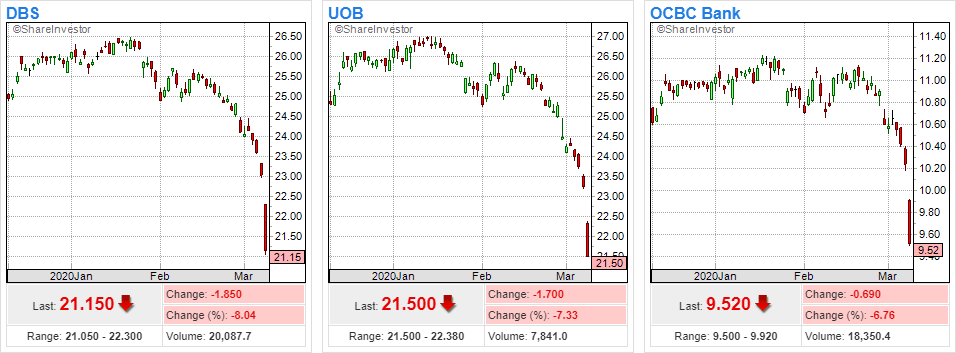
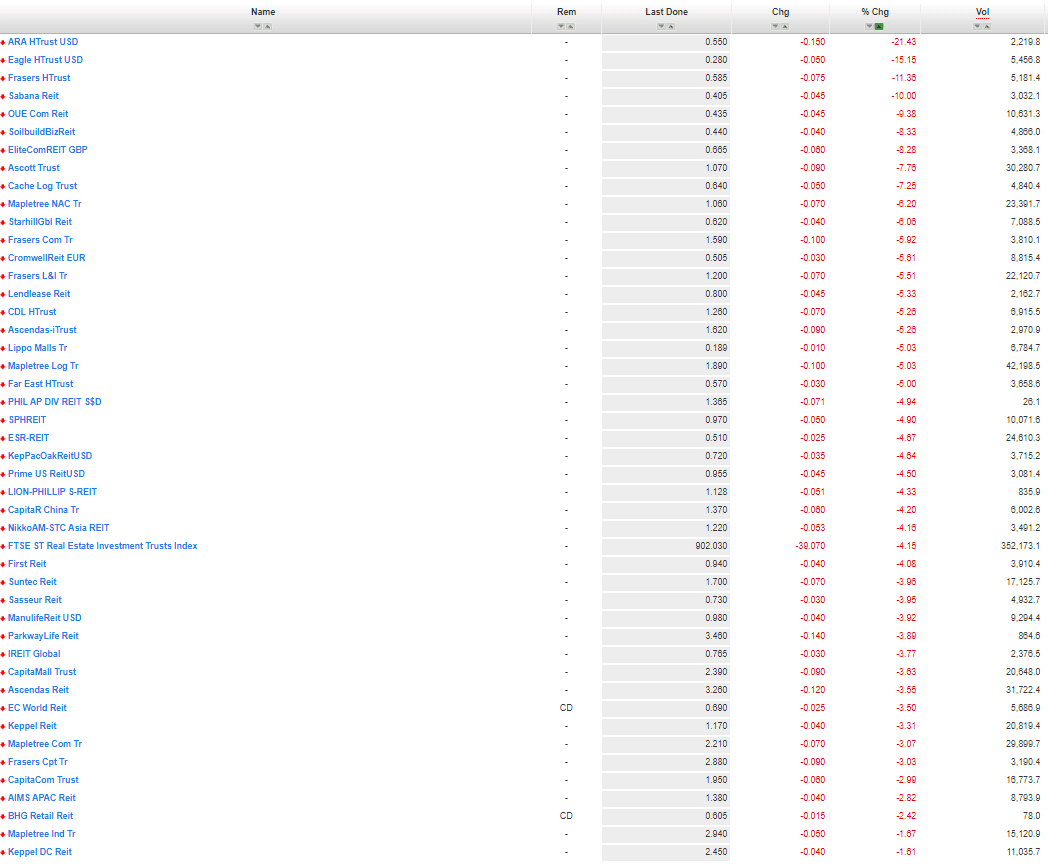
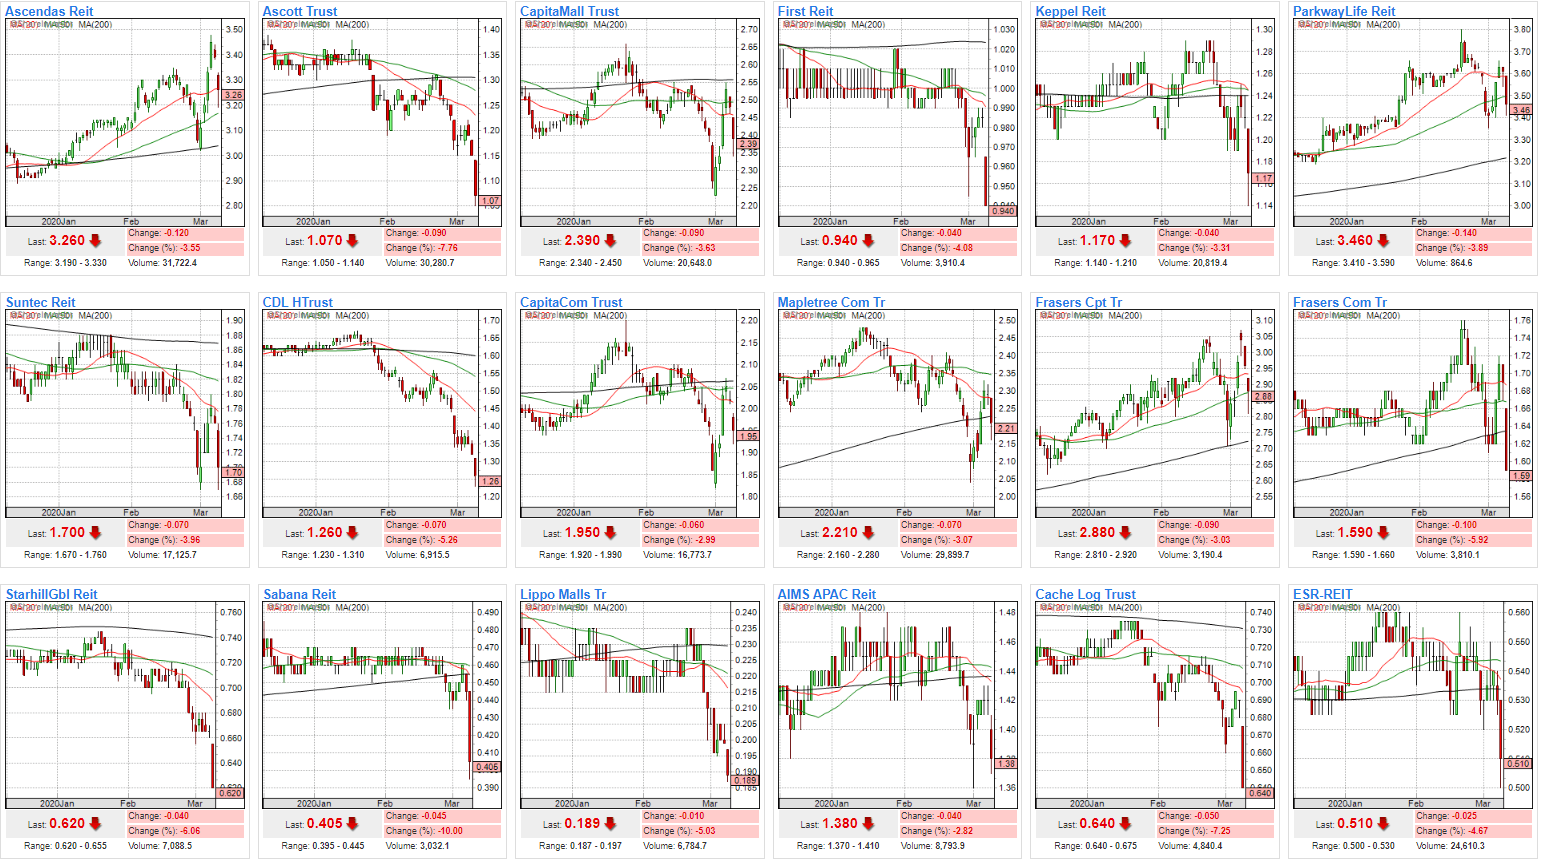
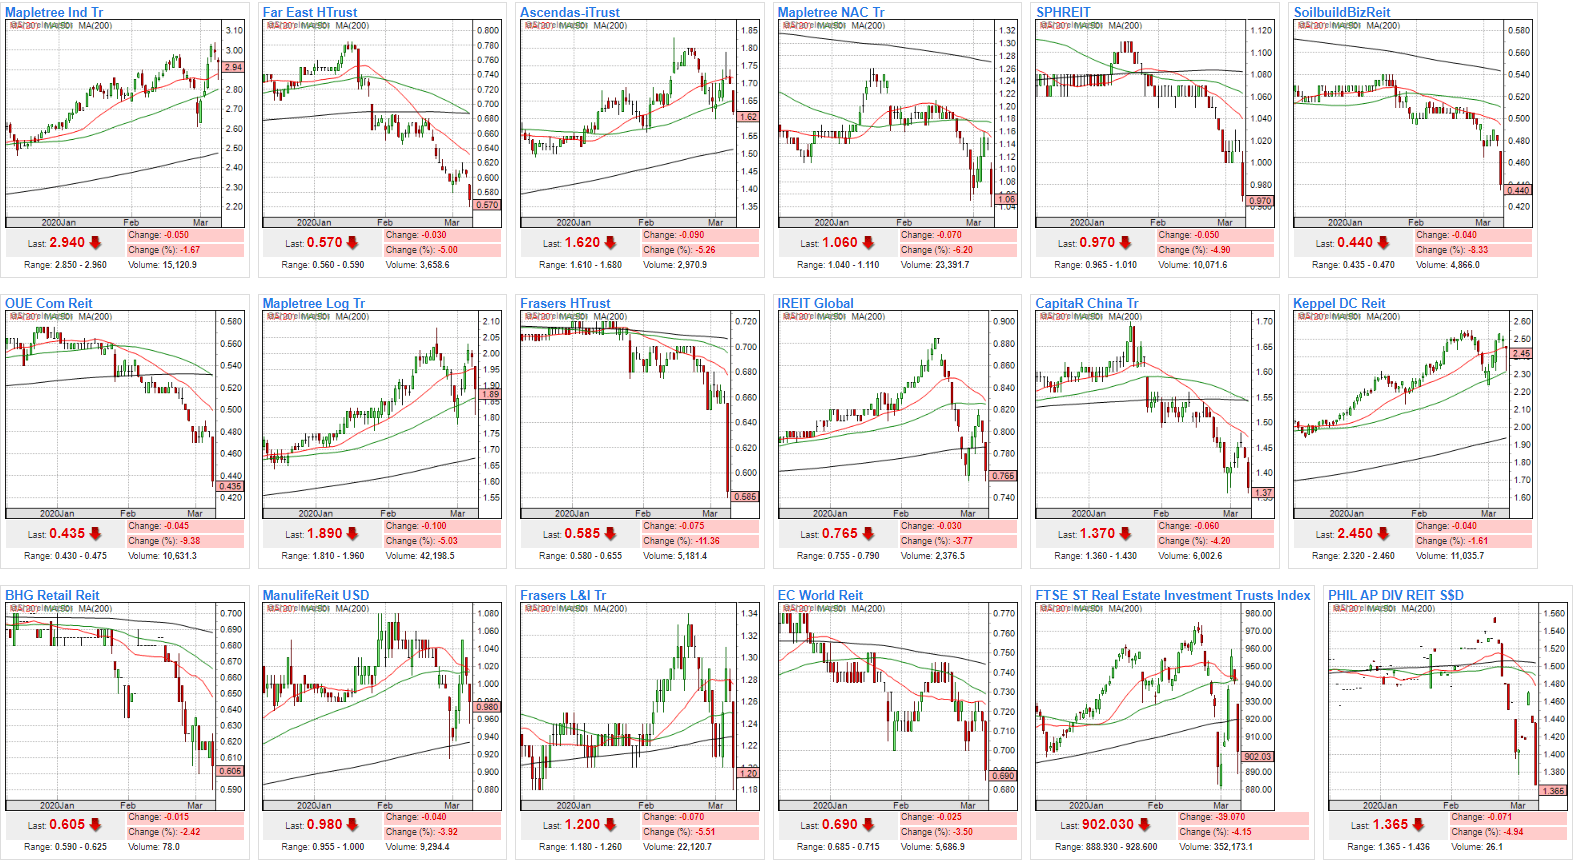
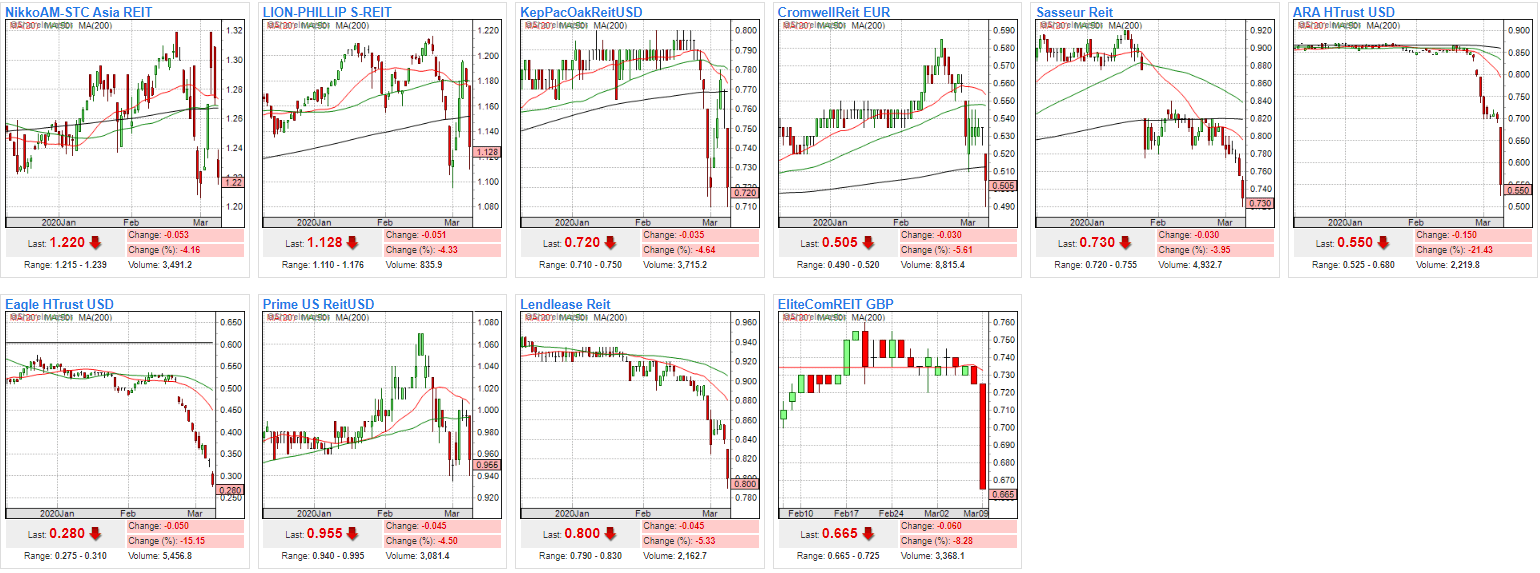
We have Crazy REIT Sales for the past 2-3 weeks. If investors know how to capture the opportunities, there is high probability investors to become Crazy Rich Asian in 3-5 years time with a properly designed high performing REIT portfolio.
Catch Kenny Loh on MoneyFM 89.3 with Michelle Martin.

https://omny.fm/shows/money-fm-893/money-and-me-the-reit-space
Kenny Loh can be contacted through email kennyloh@fapl.sg if investors need any help in building a diversified REIT portfolio during this volatile period. Advisory Fee applied.
Kenny Loh is a Senior Consultant and REITs Specialist of Singapore’s top Independent Financial Advisor. He helps clients construct diversified portfolios consisting of different asset classes from REITs, Equities, Bonds, ETFs, Unit Trusts, Private Equity, Alternative Investments and Fixed Maturity Funds to achieve an optimal risk adjusted return. Kenny is also a CERTIFIED FINANCIAL PLANNER, SGX Academy REIT Trainer, Certified IBF Trainer of Associate REIT Investment Advisor (ARIA) and also invited speaker of REITs Sympsosium and Invest Fair. https://fa.com.sg/kennyloh/
You can join my Telegram channel #REITirement – SREIT Singapore REIT Market Update and Retirement related news. https://t.me/REITirement