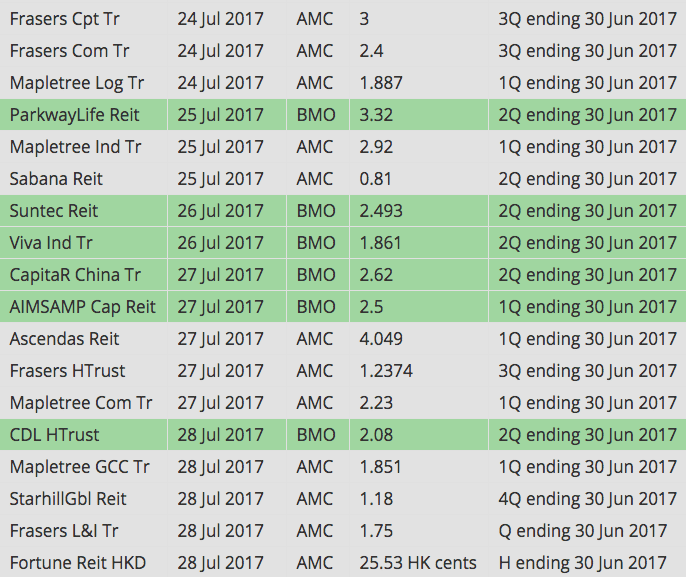
DPU summary of 18 REITs who reported this week (24-28 Jul 2017)
Here’s the DPU summary of 18 Singapore REITs who reported earnings in week of 24-28 Jul 2017…
For the full earnings calendar of Singapore REITs, click here.

Here’s the DPU summary of 18 Singapore REITs who reported earnings in week of 24-28 Jul 2017…
For the full earnings calendar of Singapore REITs, click here.
Original post from https://mystocksinvesting.com
Singapore REIT Price / NAV Range Chart base on 9 July-2017 Singapore REITs Table.
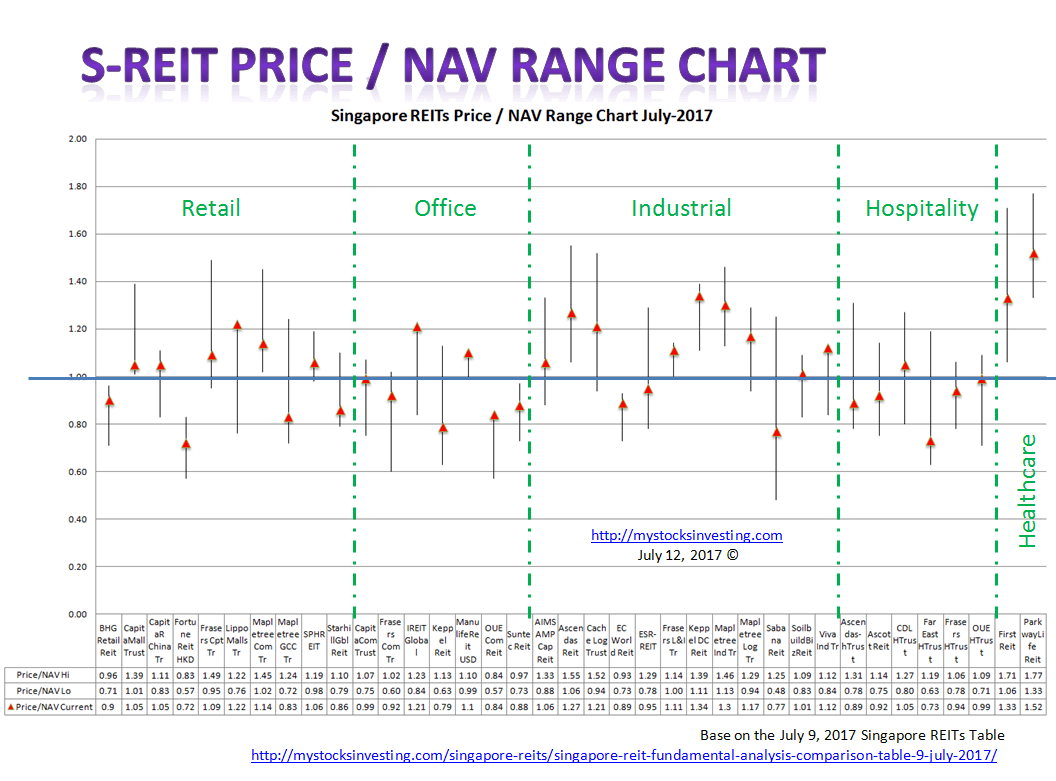
There are LAND MINES and also GEMS in the charts. Safe hunting if you know how to use it to shortlist your favorite REITs.
See last Singapore REITs Price/NAV here to see the changes. Do you think you have missed the boat?
Disclaimer: This chart is NOT a recommendation to buy or sell. Do NOT use it if you don’t understand how to interpret it.
Check below on other events:
https://mystocksinvesting.com/events/
Bubble charts derived from July 9, 2017 Singapore REITs Fundamental Comparison Table. From the charts, it can be seen that the distribution yield for most of the big cap (represented by the big bubble size) is below 6%. The yield of the small cap REITs also drop after playing catch up in the share price but still giving more than 7% yield. However, we have to be very cautious in the selection as some of those REITs have declining DPU for past few quarters.
Disclaimer: The analysis is for Author own use and NOT to be used as Buy / Sell recommendation. Get a proper training on “How to use this Singapore REIT Bubble Charts?” here.
Original Post from https://mystocksinvesting.com


These Bubble Charts are used to show the “relative” position compare to other Singapore REITs.
Two visual bubble charts to pick and avoid:
** Distribution Yield are lagging.
Compared to previous Singapore REIT Bubble Charts here.