
Singapore REIT Fundamental Analysis Comparison Table – 3 Oct 2017
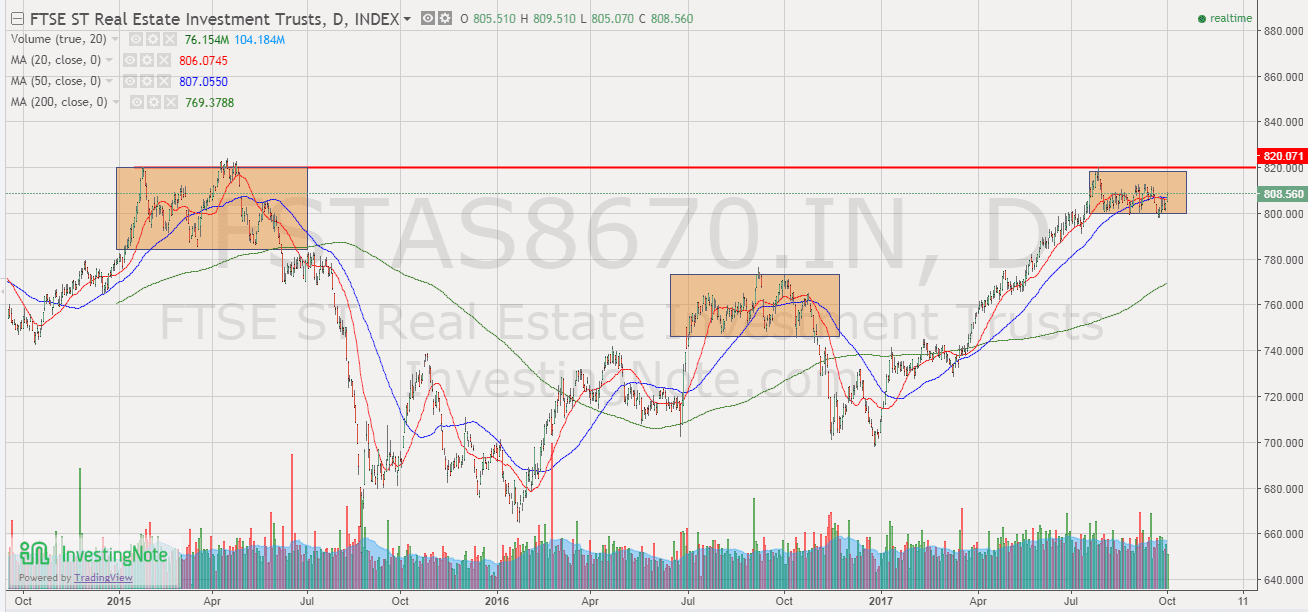
FTSE ST Real Estate Investment Trusts (FTSE ST REIT Index) decreases from 810.27 to 806.78 (-0.43%) ( compare to last post on Singapore REIT Fundamental Comparison Table on Sept 3, 2017. The index is currently facing resistance of 820 and currently trading sideway. We have to watch for the potential reversal as currently 20D and 50D are trending horizontally. Breaking the critical support of 800 will kick start the correction of Singapore REITs index.
Fundamental Analysis

- Price/NAV decreases from 1.05 to at 1.04 (Singapore Overall REIT sector is slightly over value now).
- Distribution Yield increases from 6.51% to 6.53% (take note that this is lagging number). About one third number of Singapore REITs (11 out of 37) have Distribution Yield > 7%. This is a significant drop in numbers compare to a few months ago. This indicates there are lesser Singapore REITs with attractive yield to pick now.
- Gearing Ratio remains at 34.7%. 20 out of 37 have Gearing Ratio more than 35%. In general, Singapore REITs sector gearing ratio is healthy.
- Most overvalue REIT is Parkway Life (Price/NAV = 1.62), followed by Keppel DC REIT (Price/NAV = 1.43), First REIT (Price/NAV = 1.33), Mapletree Industrial Trust (Price/NAV = 1.34) and Ascendas REIT (Price/NAV = 1.31)
- Most undervalue (base on NAV) is Fortune REIT (Price/NAV = 0.68), followed by Far East HTrust (Price/NAV = 0.75) and Keppel REIT (Price/NAV = 0.84) and OUE Com REIT (Price/NAV = 0.83).
- Highest Distribution Yield (TTM) is Cache Logistic Trust (8.74%), followed by SoilBuild BizREIT (8.46%), Lippo Mall Indonesia Retail Trust (8.19%) and iREIT Global REIT (7.95%).
- Highest Gearing Ratio is Cache Logistic Trust (43.4%), iREIT Global (41.3%).
Disclaimer: The above table is best used for “screening and shortlisting only”. It is NOT for investing (Buy / Sell) decision. To learn how to use the table and make investing decision, Sign up next REIT Investing Seminar here to learn how to choose a fundamentally strong REIT for long term investing for passive income generation.
Economy Analysis – Singapore
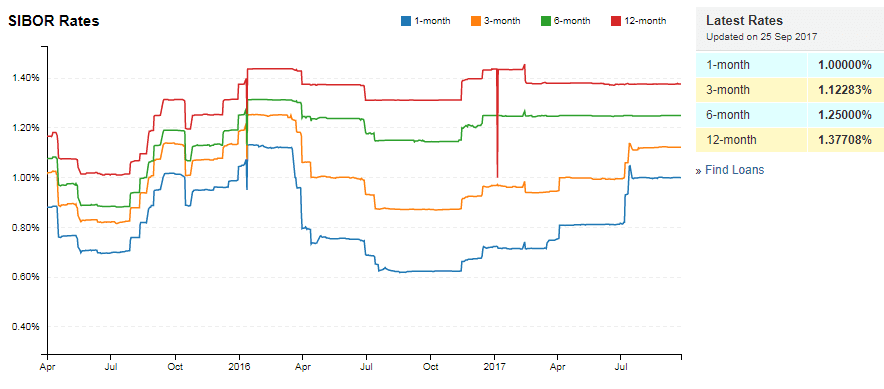
- 1 month increases from 0.99900% to 1.00000%
- 3 month increases from 1.11175% to 1.12283%
- 6 month increases from 1.24800% to 1.25000%
- 12 month increases from 1.37658% to 1.37708%
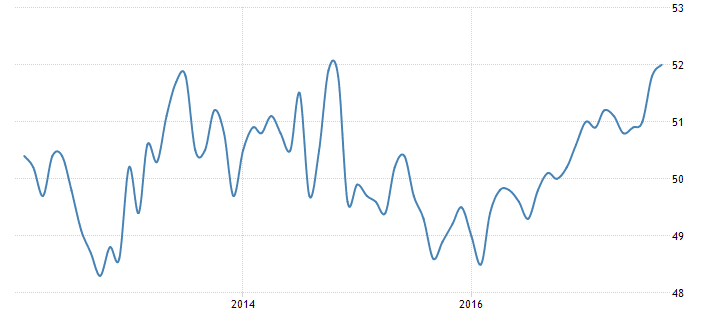
The Singapore Manufacturing PMI increased to 52 in September 2017 from 51.8 in the previous month. The reading pointed to the fastest pace of expansion in the manufacturing sector since April 2011, boosted by growth in new orders, new exports, output and employment. The PMI for the electronics sector rose 0.4 points to 53.6 in September, also the highest in more than six years. Manufacturing PMI in Singapore averaged 50.19 from 2012 until 2017, reaching an all time high of 52 in September of 2017 and a record low of 48.30 in October of 2012.
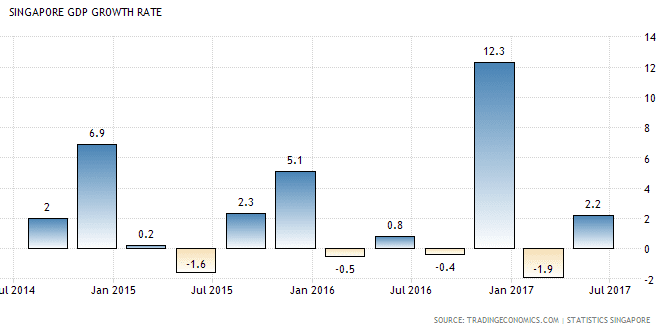
The Gross Domestic Product (GDP) in Singapore expanded 2.20 percent in the second quarter of 2017 over the previous quarter. GDP Growth Rate in Singapore averaged 6.78 percent from 1975 until 2017, reaching an all time high of 37.20 percent in the first quarter of 2010 and a record low of -13.50 percent in the fourth quarter of 2008.
Summary
Fundamentally the whole Singapore REITs is slightly over value. Office and Hospitality sectors are still undervalue but have not seen any clear turnaround signs yet. Technically Singapore REITs is currently facing the resistance of 820 and will turn to medium term bearish if 800 support is broken. This correction may present a great opportunity to accumulate REITs as the Singapore economy fundamental is strengthening.
This is the time we have to start to do homework and wait for the correction to plan the entry. I will be sharing how to find the fundamental strong REITs and how to time the entry in my Investing in Singapore REIT course here.
If you do not have time to do all the analysis and monitor the stock market, there is a solution for you … REITs Portfolio Advisory. I will help you to build a Diversified REITs portfolio for you. I will do all the work by selecting fundamental strong REIT, time the entry, monitor the quarterly earning performance, sell the weak REITs, etc. https://mystocksinvesting.com/course/private-portfolio-review/
See all other relevant Singapore REITs blog posts here.
Check out coming seminars at https://mystocksinvesting.com/events

