Global Stock Market Indices PE & PB Ratio At a Glance (1 Jan 2015)
Happy New Year 2015!
The following market data can give an inside view on what could be the stock market outlook in 2015.
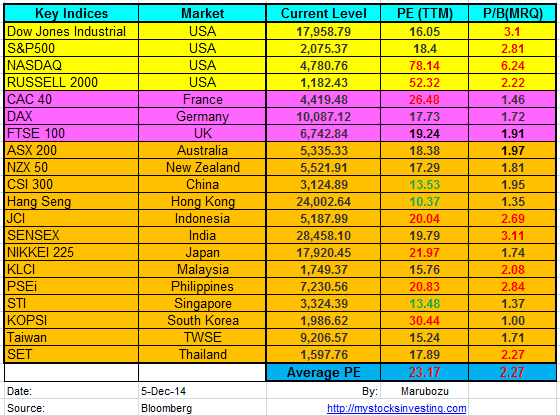
Market Indices PE & PB Ratio for Major Stock Exchange globally
- US: Dow Jones Industrial, S&P500, NASDAQ, Russell 2000
- Europe: FTSE100, CAC40, DAX
- Asia: KLCI, STI, HangSeng, ASX200, CSI 300, JCI, SET, KOPSI, NIKKEI 225, SENSEX, TWSE, NZX50, PSEi

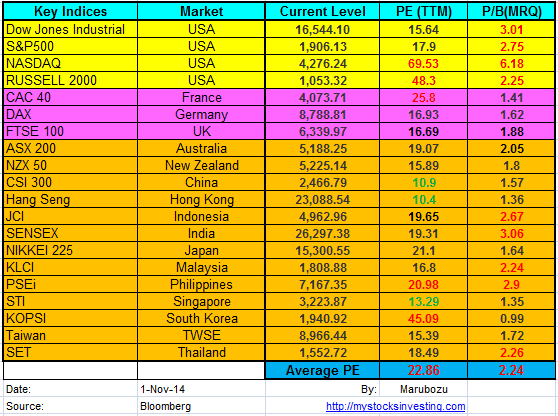
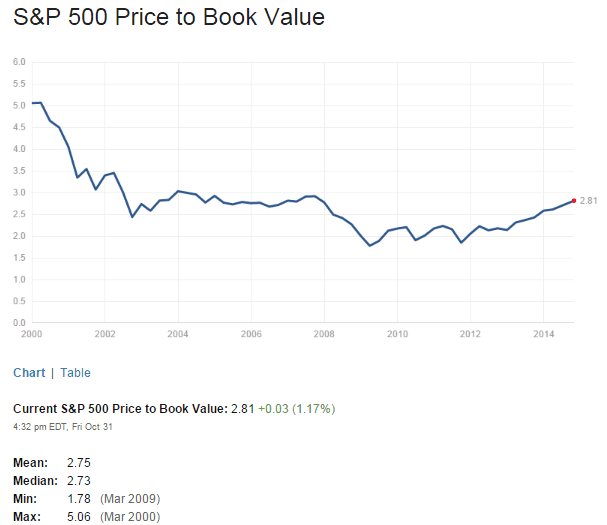
Dow Jones Industrial, S&P500 and NASDAQ are still on uptrend but have shown the reversal candlestick pattern at the last trading day of 2014. Average PE ratio decreases from 23.17 to 21.30 whereas PB Ratio decreases from 2.27 to 2.22. Most of the stock market now are overvalue now. Technically $INDU, $SPX, $COMP are all on clear up trend and we are entering a seasonally most bullish six months from Nov to April base on past statistics. However, it is important to be cautious that stock market may go through the sharp correction after the QE ends. At the moment, we may still in the middle of Santa Claus Rally.
See Dec 2014 Global Stock Market PE Ratio here.


- PE = Price Per Earning
- PB = Price To Book Value
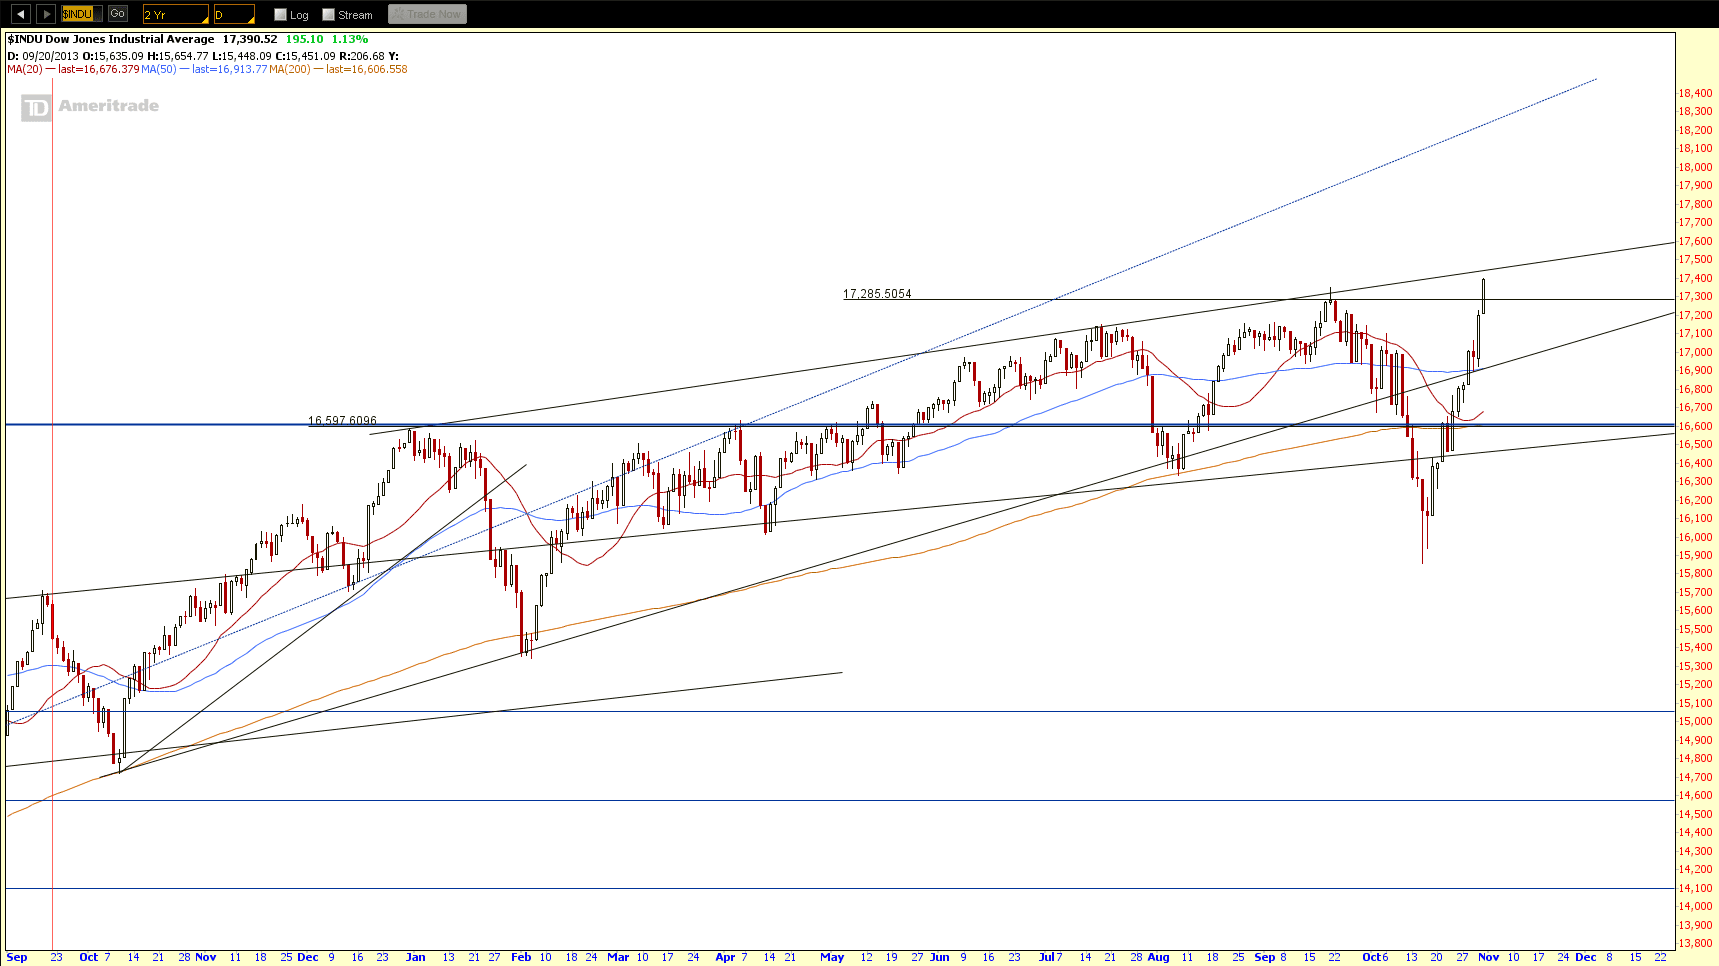
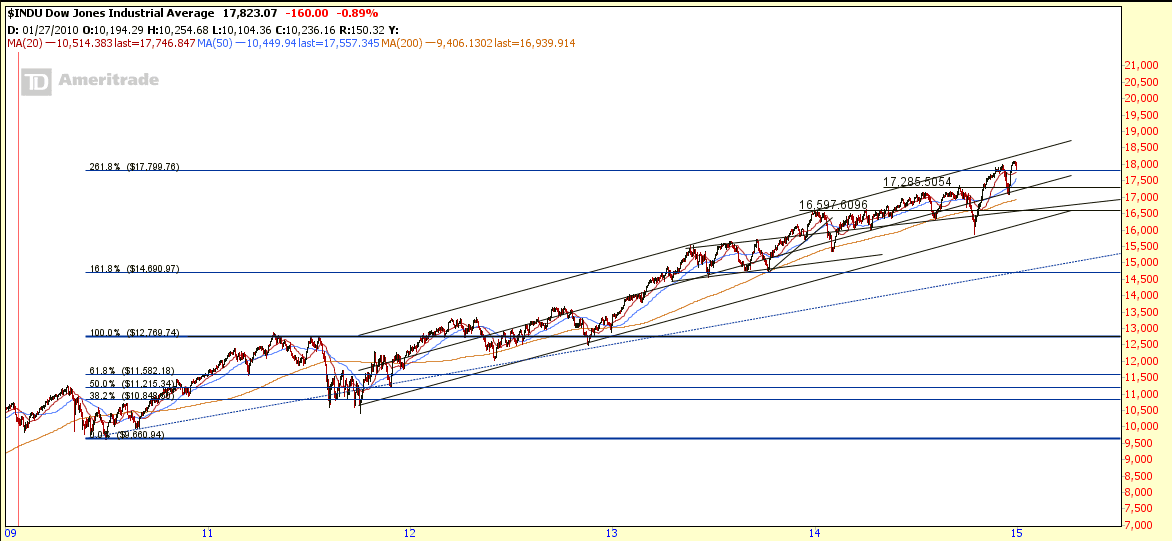
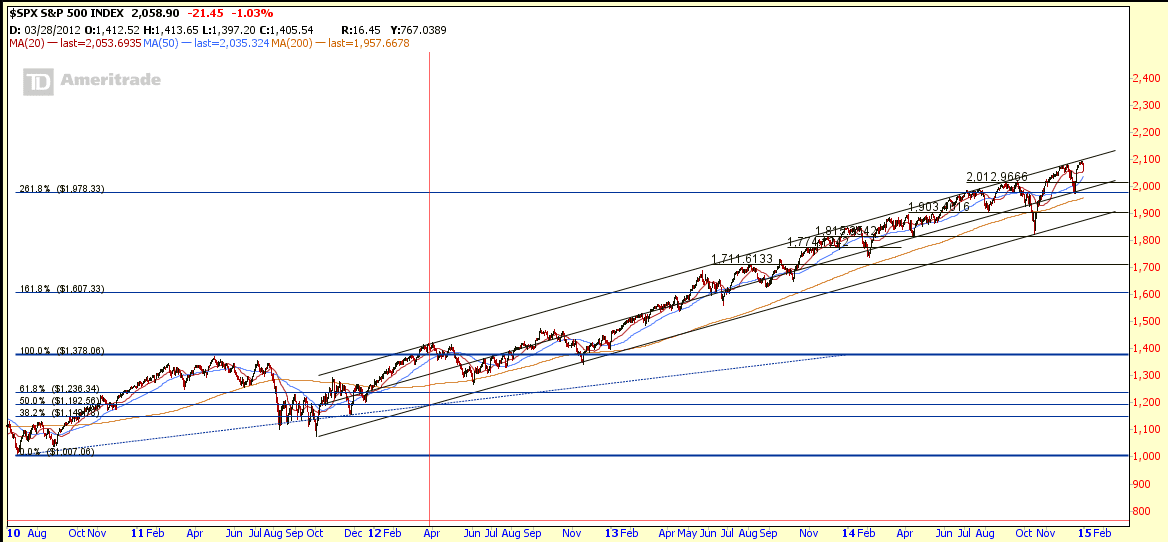
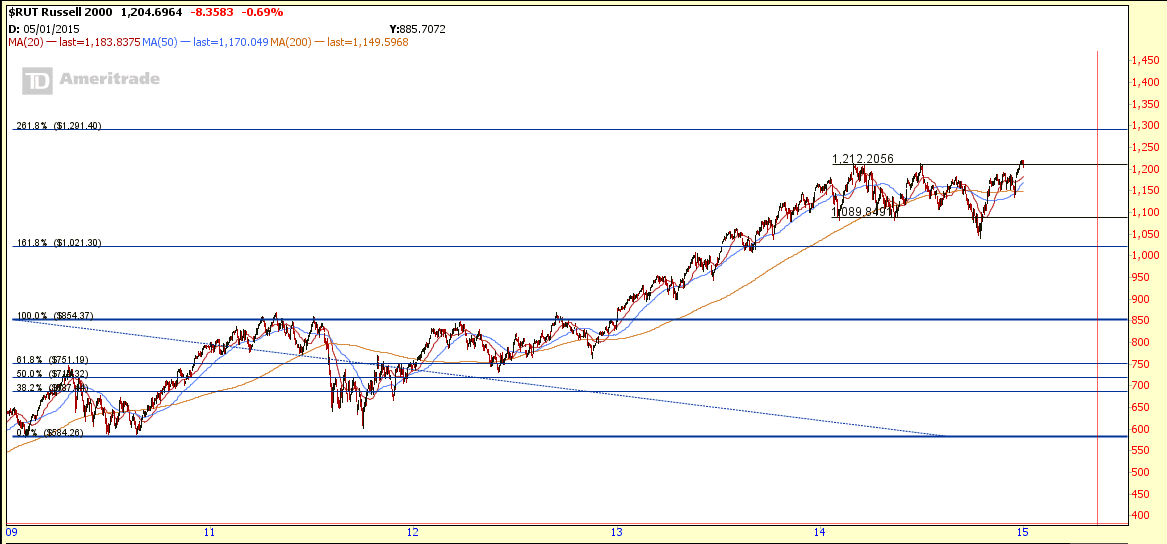
Dow Jones Industrial, S&P500, NASDAQ, Russel 2000 Charts
- INDU, SPX, COMP are still on uptrend but show short term reversal pattern.
- RUT is trading sideway but hitting the resistance.

Past 1 Month Sector Performance

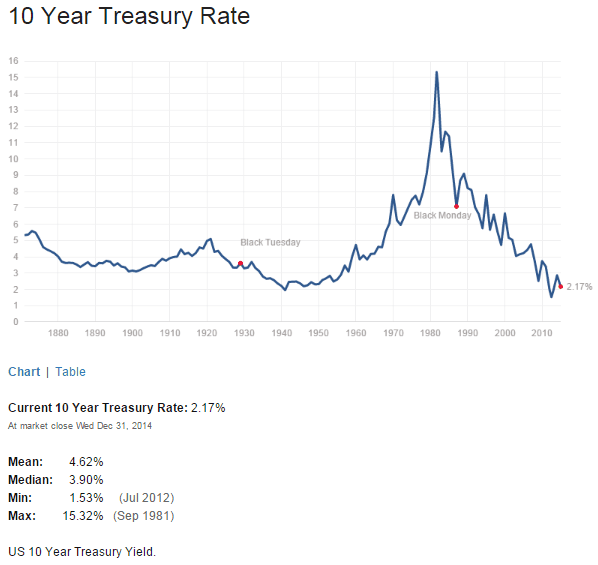
Treasury Yield


- If you want to understand how to conduct the above stock market analysis, how and where to find the free (and right) data from internet, how to analyse the data, how to combine all the analysis and form an own opinion to predict the stock market next moment? Check out the Fundamental Analysis Class here.