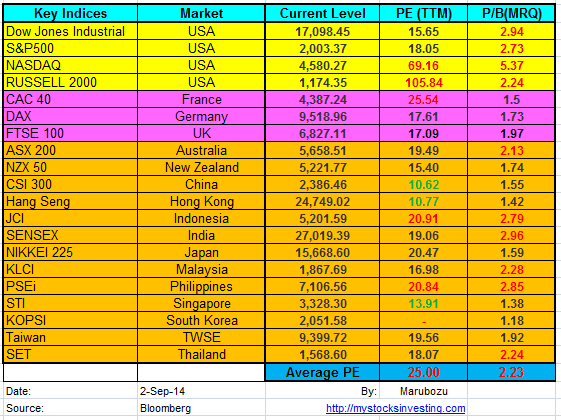
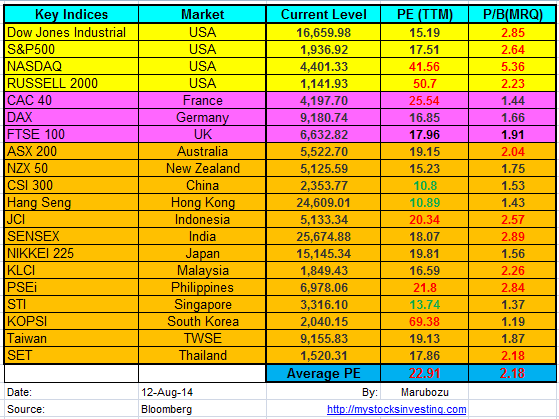
Global Stock Market Indices PE Ratio At a Glance (11 Oct 2014)
Market Indices PE Ratio for Major Stock Exchange globally.
- US: Dow Jones Industrial, S&P500, NASDAQ, Russell 2000
- Europe: FTSE100, CAC40, DAX
- Asia: KLCI, STI, HangSeng, ASX200, CSI 300, JCI, SET, KOPSI, NIKKEI 225, SENSEX, TWSE, NZX50, PSEi
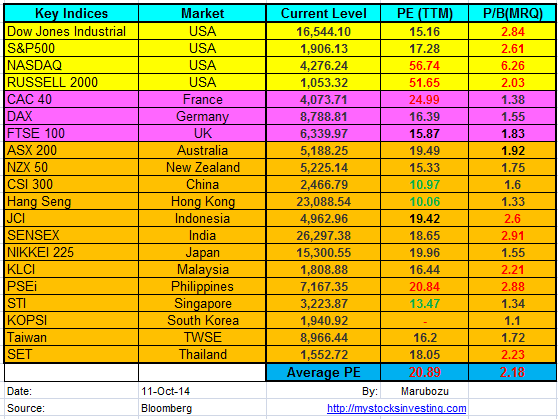
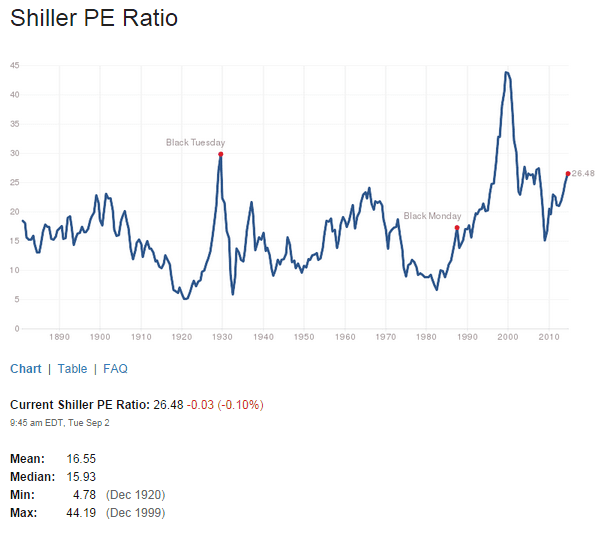
Average PE ratio decreases from 25 to 20.89 due to the past 2 weeks global stock market sell down. This correction is long over due and there are already tons of warning sign base on technical analysis and stock market valuation. RED ALERT for NASDAQ with PE of 56.74 and RUSSELL 2000 of 51.65!
See Sept 2014 Global Stock Market PE Ratio here.


- PE = Price Per Earning
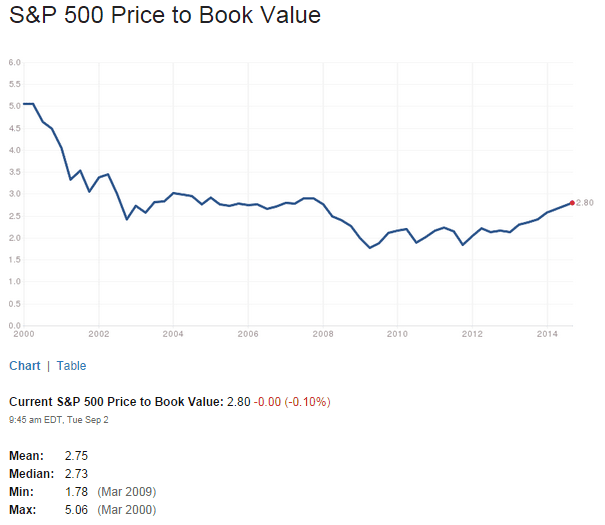
- PB = Price To Book Value
- Want to Learn More about how to value the stock market using PE Ratio or PB Ratio? Check out the Fundamental Analysis Class here.