Singapore REIT Price / NAV Range Chart Jan-2017
Original post from https://mystocksinvesting.com
Singapore REIT Price / NAV Range Chart base on 2 Jan-2017 Singapore REIT Table.
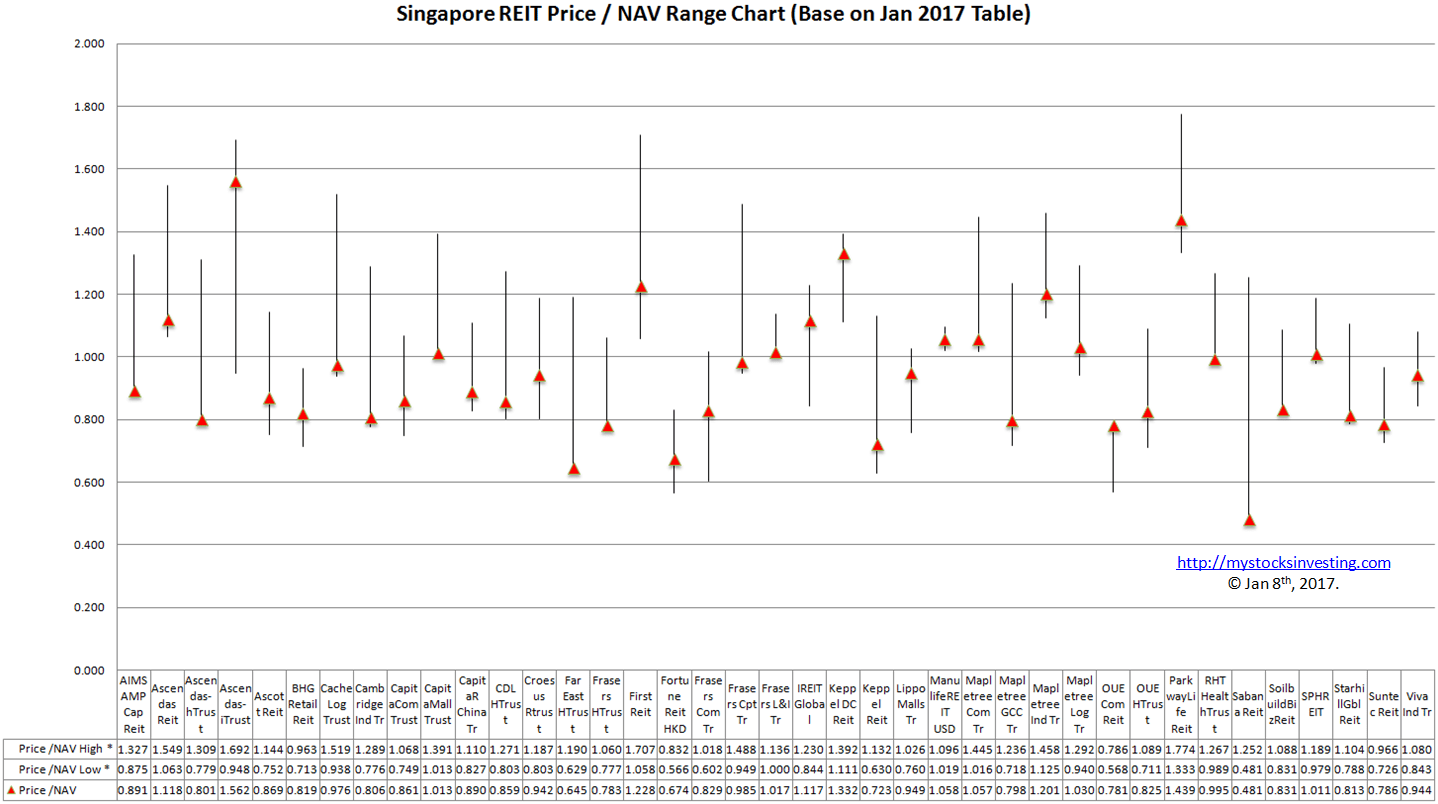
Safe hunting if you know how to use it to shortlist your favorite REITs.

Original post from https://mystocksinvesting.com
Singapore REIT Price / NAV Range Chart base on 2 Jan-2017 Singapore REIT Table.
Safe hunting if you know how to use it to shortlist your favorite REITs.
See previous week Weekly Inter Market Analysis.
Original post from https://mystocksinvesting.com
SPY (SPDR S&P500 ETF)
Profit taking after SPY reached the all time high of 227.75 entering into 2017. SPY immediately rebounded after a small retracement back to 223 support. A healthy retracement is needed for SPY to move higher. Take note that bullish seasonal cycle between Nov to April.

VIX
VIX continues to stay within the complacent zone at 14.0. No fear entering into 2017. The inauguration of Donald Trump as the 45th President of the United States will be held on Friday, January 20, 2017. Let’s see whether the market is worried about what he is going to say, and prepared for the shock!

Sector Performance (SPDR Sector ETF)

SUDX (S&P US Dollar Futures Index)
SUDX is currently facing resistance at about 138 and currently take a breather. The trend remains up for US Dollar.

FXE (Currency Shares Euro ETF)
FXE rebounded from the support at around 100.65 but is still trading within a down trend channel. FXE is currently testing the channel resistance and also the support turned resistance level (horizontal red line) at about 102.88. Expect more down ward pressure for FXE if rejected at this resistance.

XLE (SPDR Energy Sector ETF)
XLE is currently retracing and forming a Bullish Pennant after hitting the recent high of 78.34. If XLE can find the support at 74.87 or 71.84, the bull has strength to move XLE higher.

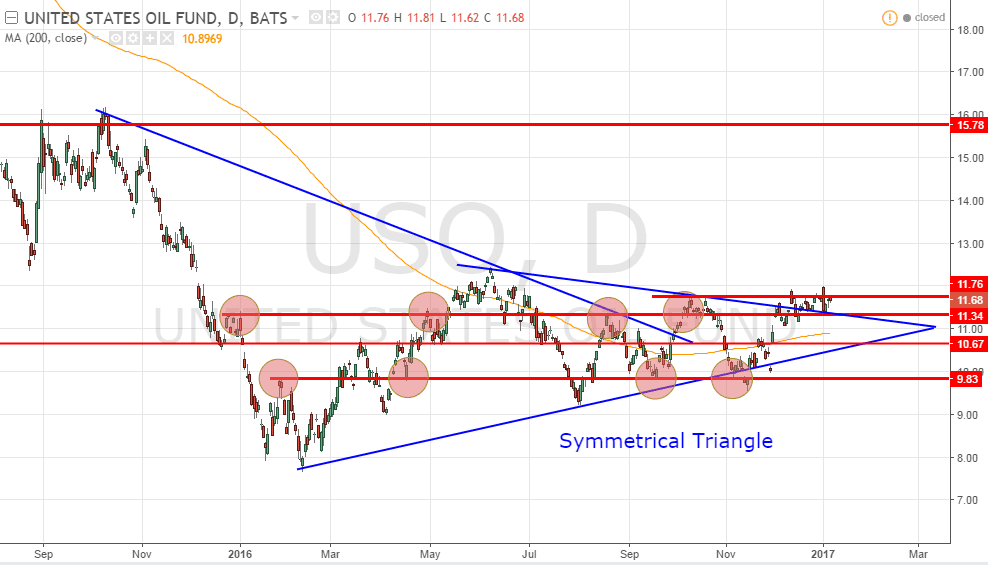
USO (United States Oil Fund)
USO is currently facing the rectangle resistance zone. USO is still trading side way until a more convincing breakout. Opportunity for bullish trade when USO breaks out upward from this consolidation range.
TLT (iShares 20+ Years Treasury Bond ETF)
TLT is finding support at 117-118 and is current rebounding. Fibonacci Retracement level is redrawn to find next potential resistance. Next resistance zone about 127-128 at 38.2% Fibonacci Retracement level and also the previous support turned resistance. The trend remains down for TLT.

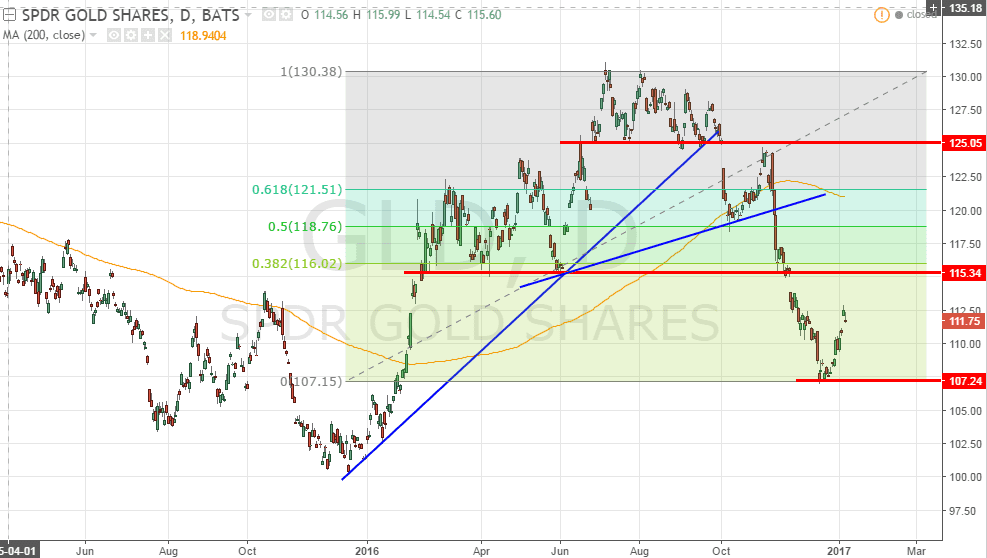
GLD (SPDR Gold Shares)
GLD is rebounding from the support at about 107 after the huge sell off. Fibonacci Retracement level is redrawn to find next potential resistance. Next resistance zone about 115-116 at 38.2% Fibonacci Retracement level and also the previous support turned resistance. The trend remains down for GLD.
Read the article on Ringing in the New Year with a Bullish Case for Gold here.
Next Week Economic Calendar
Key events:

See upcoming Events here. https://mystocksinvesting.com/events/
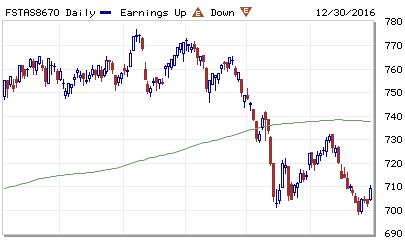
FTSE ST Real Estate Investment Trusts (FTSE ST REIT Index) decreases from 722.05 to 709.49 (-1.74%) compare to last post on Singapore REIT Fundamental Comparison Table on Dec 5, 2016. The index is trading below the 200D SMA. Take note that the 200D SMA is no longer sloping up and is currently flat. If the index continues to trade below 200D SMA and the 200D starts to slope down, the Singapore REIT sector will reverse to a confirmed down trend. FTSE ST Real Estate Investment Trust Index is currently forming a Falling Wedge and is finding a short term support at about 700. Keep an eye to see whether this support holds in the next few months. SGX S-REIT (REIT.SI) Index decreases from 1111.15 to 1092.36 (-1.69%).

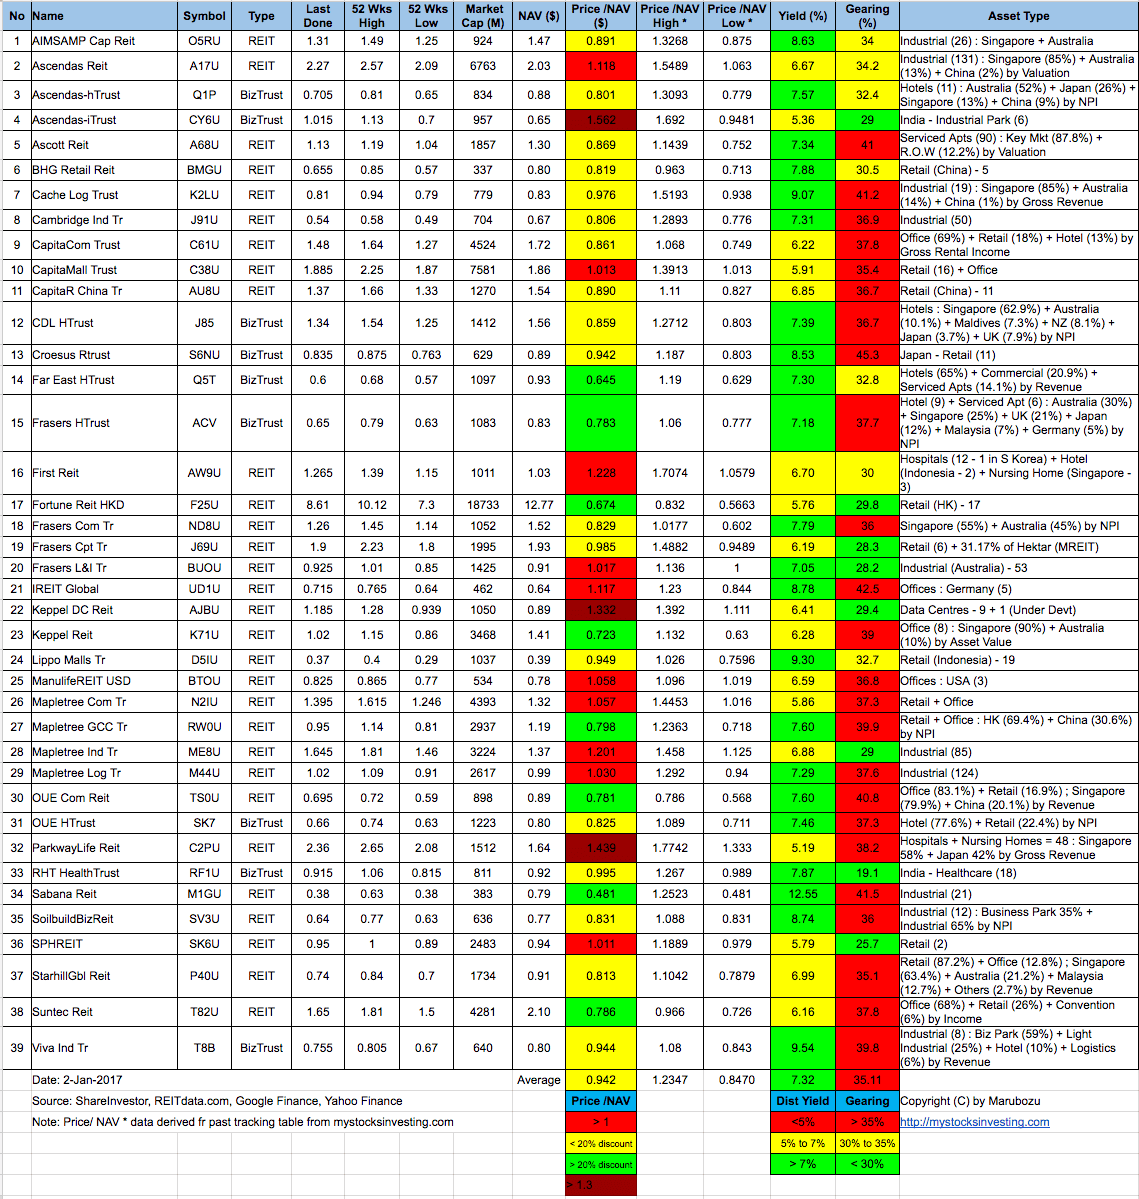
Disclaimer: The above table is best used for “screening and shortlisting only”. It is NOT for investing (Buy / Sell) decision. To learn how to use the table and make investing decision, Sign up next REIT Investing Seminar here to learn how to choose a fundamentally strong REIT for long term investing for passive income generation.


Manufacturing PMI in Singapore increased to 50.20 in November from 50 in October of 2016. Manufacturing PMI in Singapore averaged 50.03 from 2012 until 2016, reaching an all time high of 51.90 in October of 2014 and a record low of 48.30 in October of 2012.

The Singaporean economy contracted a seasonally-adjusted annualized 2 percent on quarter in the three months to September of 2016, compared to a 4.1 percent decline in preliminary estimates. Markets were expecting a 2.5 percent contraction. GDP Growth Rate in Singapore averaged 6.82 percent from 1975 until 2016, reaching an all time high of 37.20 percent in the first quarter of 2010 and a record low of -13.50 percent in the fourth quarter of 2008.
Singapore REITs sector continued the selling off after US Fed rate hike. Technically FTSE ST REIT index is bearish and is on down trend. Another round of sell off is expected if the index breaks the 700 support level. Current valuation base on Price/NAV and Distribution yield become attractive again. As long as the index finds a good support at 700, there are good opportunities to pick up some fundamental strong REIT. Two questions may interest all the retail investors: WHEN is the right and safe time and WHAT REIT to pick? Check out the next Investing in Singapore REIT course here.
See my Singapore REIT 2017 Market Outlook here.
Original post from https://mystocksinvesting.com
Check out coming seminars at https://mystocksinvesting.com/events