Singapore REIT Fundamental Analysis Comparison Table – 1 June 2015

  • Post author:

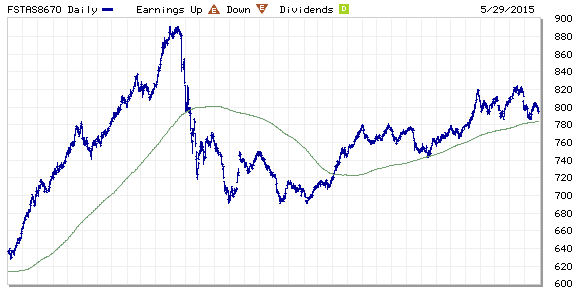
FTSE ST Real Estate Investment Trusts (FTSE ST REIT Index) decreases from 802.45 to 795.76 compare to last post on Singapore REIT Fundamental Comparison Table on May 1, 2015. The index is continuing the uptrend and supported by the 200D SMA. However do take note that the index is trading below 20D and 50D SMA at the moment. Immediate resistance at about 800 and support at 780. Take extreme cautious that Head and Shoulder in formation with neckline at about 780. This is a trend reversal pattern.

Learn Stock Chart Pattern and Technical Analysis here.

FTSE ST REIT Index June1-2015

  • Price/NAV decreases not much change at 1.05.  (Singapore REIT in general slightly overvalue)
  • Distribution Yield increases from 6.46% to 6.48%.
  • Gearing Ratio increases from  33.71% to 34.08%
  • Most overvalue REIT is FIRST REIT (Price/NAV = 1.44), followed by Parkway Life (Price/NAV = 1.40). Both Healthcare REIT, Defensive in nature.
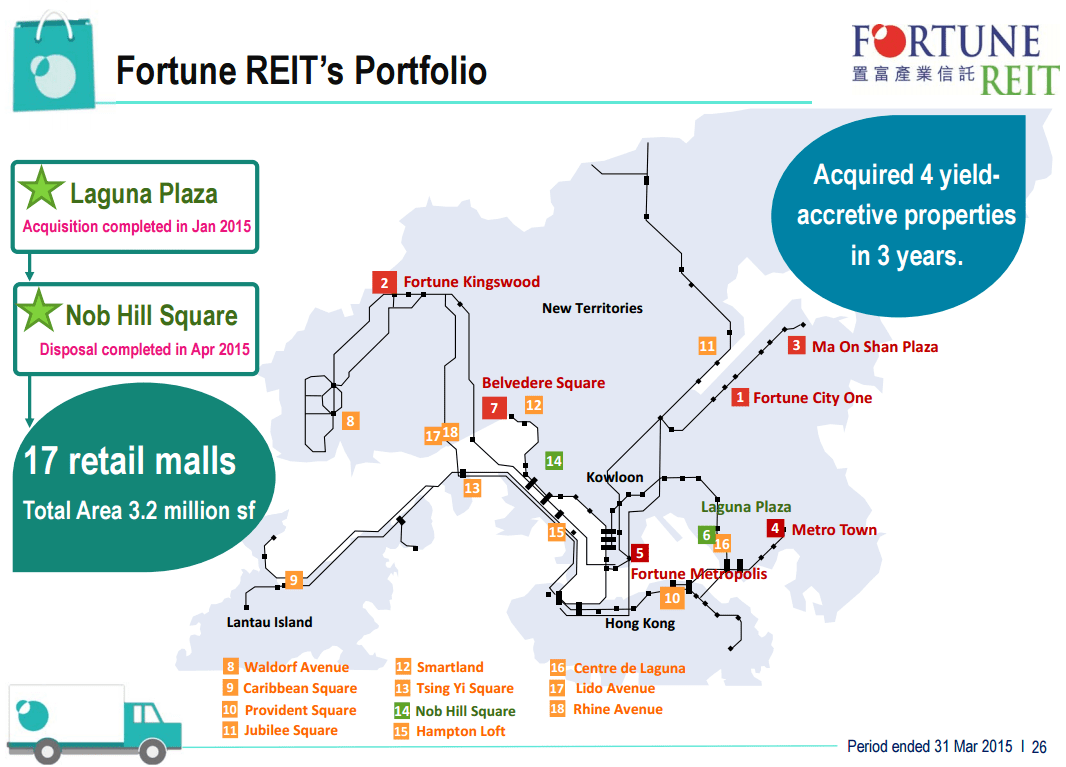
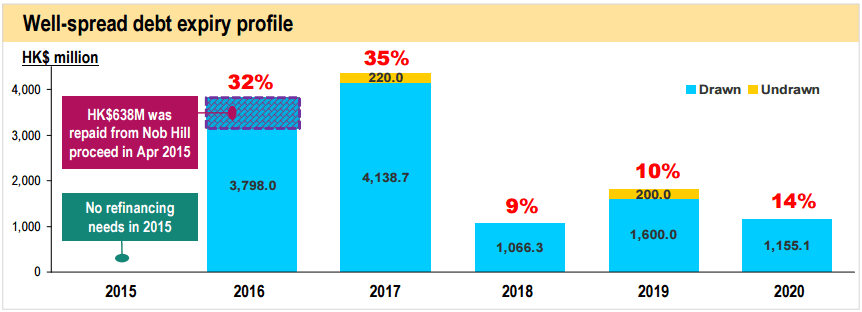
  • Most undervalue REIT is Fortune REIT (Price/NAV = 0.65), followed by OUE Commercial Trust (Price/NAV = 0.75).
  • Higher Distribution Yield is VIVA Industrial Trust (9.13%) followed by Sabana REIT (8.4%). Note: High Distribution Yield does not mean it is safe REIT for investment. Don’t invest purely base on the Yield % because it is wrong thing to do without knowing the reasons.
  • Highest Gearing Ratio is Croesus Retail Trust (50.4%) followed by VIVI Industrial Trust (43.4%)

Singapore-REIT-Fundamental-Analysis-and-Comparison-Table-1-Jun-2015Singapore Interest Rate June1-2015SIBOR June1-2015


  • Singapore Interest Rate reduces from 0.34% to 0.22%.
  • 1 month decreases from 0.76525% to 0.70696%.
  • 3 month decreases from 0.89095% to 0.82955%.
  • 6 month decreases from 0.97018% to 0.88909%.
  • 12 month decreases from 1.07621% to 1.01839%.

As we are entering into the month of June, all eyes are on US Federal Reserve whether they will raise the interest. The Fed will definitely increase the interest rate. The question is when? Interest hike will affect the borrowing cost, it is time for all the Investors to review your current investment portfolio and debt profile. Plan the next step before the day comes because it will affect your investment and loan monthly installment. Take initiative to evaluate your current mortgage loan and work on Refinance Plan before the mortgage loan interest shot up even further.

Fed’s Fischer sees short-term rate at 3.25%-4% in three to four years


Grab an insight of the REIT class here 3 Tips To Increasing Returns On REITs Investments

Check out the very pragmatic and educational public seminar here “Investing in Singapore REIT“.

Continue ReadingSingapore REIT Fundamental Analysis Comparison Table – 1 June 2015

Fortune REIT Fundamental and Technical Analysis

  • Post author:

Fortune REIT Fundamental Analysis

  • Last Done Price = HK$7.77
  • NAV = HK$11.87
  • Price /  NAV = 0.654 (35.6% Discount to NAV)
  • Price /  NAV (High) = 0.832
  • Price /  NAV (Low) = 0.566
  • Distribution Yield = 5.8%
  • Gearing Ratio = 33.2%
  • Occupancy Rate = 98.1%

Last Fundamental Analysis for Fortune REIT.

Fortune REIT Malls Location May29-2015Fortune REIT Occupancy Rate May29-2015Fortune REIT Debt Profile May 29-2015Fortune REIT WALE May29-2015

Currency Risk

SGD HKD Exchange Rate May30-2015


Fortune REIT Technical Analysis

Fortune REIT has dropped about 13% from the high of about HK$9.00 and currently just sitting on the 200D SMA support. Coincidentally this 200D SMA is also the 61.8% Fibonacci Retracement Support. Watch closely whether this support level holds. If yes, it may be a good entry level to those who are interest to invest in Fortune REIT for the 6% Dividend Yield.

2015May29-Fortune Reit HK$-800x600


Check out the hands on REIT Investing class here to learn how to conduct Fundamental Analysis and Technical Analysis on Singapore REIT. Equip yourself the financial knowledge on how to select a Fundamental strong REIT to generate consistent passive income.

Timing is very important in stock investing because you will still lose money when you invest in the market down trend. You can use Technical Analysis to identify the trend to maximize your profit and protect yourself from losing money.

Continue ReadingFortune REIT Fundamental and Technical Analysis

Lippo Malls Indonesia Retail Trust (LMIR) Fundamental and Technical Analysis

  • Post author:

Lippo Malls Indonesia Retail Trust (LMIR) Fundamental Analysis

  • Last Done Price = $0.365
  • NAV = $0.42
  • Price /  NAV = 0.869 (13.1% Discount)
  • Price /  NAV (High) = 1.022
  • Price /  NAV (Low) = 0.76
  • Distribution Yield = 7.86% (base on DPU TTM)
  • Distribution Yield = 8.65% (assume 0.79 cents for next 4 Quarters)
  • Gearing Ratio = 31.6%
  • WALE = 4.90 Years
  • WADB = 1.86 Years

Last Fundamental Analysis for Lippo Malls Indonesia Retail Trust (LMIR)

Lippo Malls WADM May27-2015 Lippo Malls WALE May27-2015


Currency Risk

SGD IDR Exchange May27-2015


Lippo Malls Indonesia Retail Trust (LMIR) Technical Analysis

Lippo Malls May27-2015LMIR is on short term up trend (20 and 50D SMA trending up) and currently testing the 200D SMA resistance.


Summary

Fundamentally valuation and yield looks attractive and down side risk is limited to my own risk appetite. Technically LMIR has found the bottom at $0.30 and the trend is reversing. Current level looks like attractive entry level to me personally for long term investing.


Continue ReadingLippo Malls Indonesia Retail Trust (LMIR) Fundamental and Technical Analysis