Hedging Pair: UOB vs OCBC
Establishing the correlation for UOB and OCBC as part of the Hedging Strategy for Singapore Stocks. Performance Charts with reference to Mar 9, 2009.
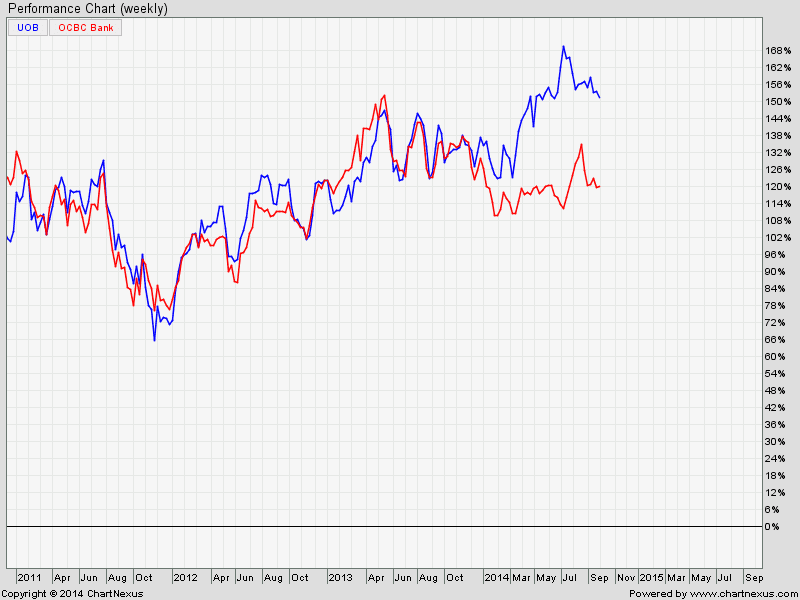
Original Post by Marubozu My Stocks Investing Journey
UOB (United Overseas Bank)

| Current P/E Ratio (ttm) | 11.8255 |
|---|---|
| Estimated P/E(12/2014) | 11.8542 |
| Relative P/E vs. FSSTI | 0.8722 |
| Earnings Per Share (SGD) (ttm) | 1.8976 |
| Est. EPS (SGD) (12/2014) | 1.8930 |
| Est. PEG Ratio | 1.5101 |
| Market Cap (M SGD) | 35,934.34 |
| Shares Outstanding (M) | 1,601.35 |
| 30 Day Average Volume | 1,441,033 |
| Price/Book (mrq) | 1.2791 |
| Price/Sale (ttm) | 3.8184 |
| Dividend Indicated Gross Yield | 3.12% |
| Cash Dividend (SGD) | 0.2000 |
| Dividend Ex-Date | 08/18/2014 |
| 5 Year Dividend Growth | 4.56% |
| Next Earnings Announcement | 10/30/2014 |
.
OCBC (Oversea-Chinese Banking Corp)

| Current P/E Ratio (ttm) | 10.6491 |
|---|---|
| Estimated P/E(12/2014) | 11.0556 |
| Relative P/E vs. FSSTI | 0.7854 |
| Earnings Per Share (SGD) (ttm) | 0.9146 |
| Est. EPS (SGD) (12/2014) | 0.8810 |
| Est. PEG Ratio | 1.2353 |
| Market Cap (M SGD) | 38,272.55 |
| Shares Outstanding (M) | 3,929.42 |
| 30 Day Average Volume | 5,418,767 |
| Price/Book (mrq) | 1.3712 |
| Price/Sale (ttm) | 3.5868 |
| Dividend Indicated Gross Yield | 3.49% |
| Cash Dividend (SGD) | 0.1750 |
| Dividend Ex-Date | 08/25/2014 |
| 5 Year Dividend Growth | 4.56% |
| Next Earnings Announcement | 10/30/2014 |