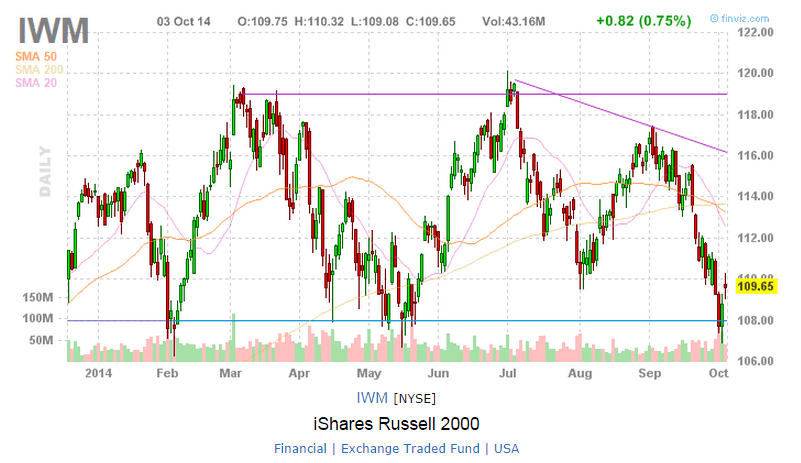
iShares Russell 2000 ETF (IWM): Rebound from Support
iShares Russell 2000 ETF (IWM) rebounded from an important support at 108 with Piercing Pattern.
Original Post by Marubozu My Stocks Investing Journey
Trade Setup
- Strategy: Short Term Directional Bullish Trade.
- Target: $113-$114
- Short Put Spread IWM 108/112 Oct 2014 (2 contracts)
- Max gain @ expiration $496
- Max loss @ expiration $309
- B/E @ expiration $109.52
- Reward vs Risk (RoC) = 1.61
- Probability OTM (short leg) = 63.25%
- Profit target = $373 (at $114 200D SMA resistance)
- Exit Conditions:
- When there is a reversal pattern at the resistance ($114)
- Break $108 support convincingly.
- Reach 80% of Max Profit (ie. $396)