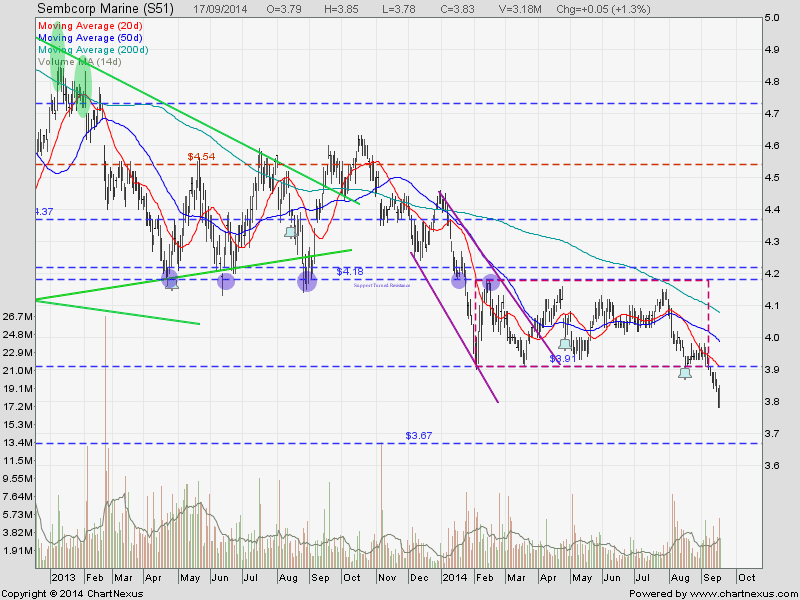
Golden Agri: Finding Support?
Golden Agri seems to find a support at about $0.50 and moving sideway for about 2 weeks. This level used to be a reliable Rectangle support. Keep a close eye if Golden Agri moves out of the down trend channel. This may be the 1st sign of trend reversal. There will be more downward pressure if this rectangle support is broken.

Original Post by Marubozu My Stocks Investing Journey
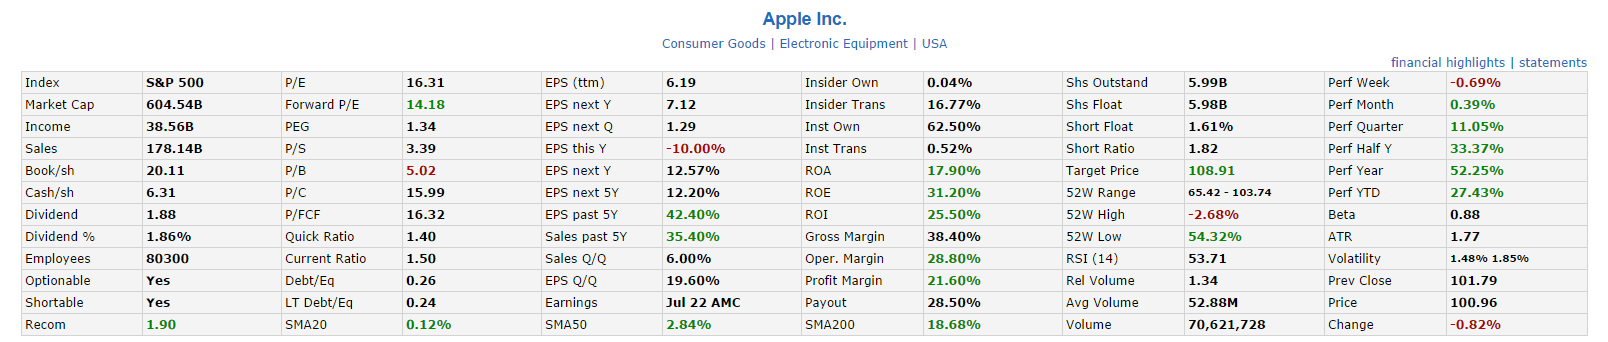
| Current P/E Ratio (ttm) | 18.0223 |
|---|---|
| Estimated P/E(12/2014) | 15.3967 |
| Relative P/E vs. FSSTI | 1.3126 |
| Earnings Per Share (USD) (ttm) | 0.0222 |
| Est. EPS (USD) (12/2014) | 0.0260 |
| Est. PEG Ratio | 1.2777 |
| Market Cap (M SGD) | 6,547.15 |
| Shares Outstanding (M) | 12,837.55 |
| 30 Day Average Volume | 25,570,330 |
| Price/Book (mrq) | 0.5840 |
| Price/Sale (ttm) | 0.6917 |
| Dividend Indicated Gross Yield | 2.16% |
| Cash Dividend (SGD) | 0.0052 |
| Dividend Ex-Date | 04/29/2014 |
| 5 Year Dividend Growth | – |
| Next Earnings Announcement | 11/12/2014 |