Disclaimer: This article is based on observations on past trends. It is not a prediction on future events that may happen in the REITs space. Please seek your financial advisor for advice.
According to Investopedia, Net Asset Value is equal to a fund’s or company’s total assets minus liabilities, divided by no. of shares. In other words, NAV = (Assets – Liabilities) / Total number of outstanding shares. NAV is usually calculated by REITs semi-annually or quarterly. Using individual REIT data and data from the StocksCafe REIT screener, below are 5 REITs whose Net Asset Value is on a downtrend since Q1 2015. The below table shows the % Reduction in NAV in 6 years, between Q1 2015 and Q1 2021.

Below is an overview of the 5 REITs listed above, sorted according to the highest loss in NAV since Q1 2015. An NAV chart is also provided. The charts are taken from the StocksCafe REIT screener.
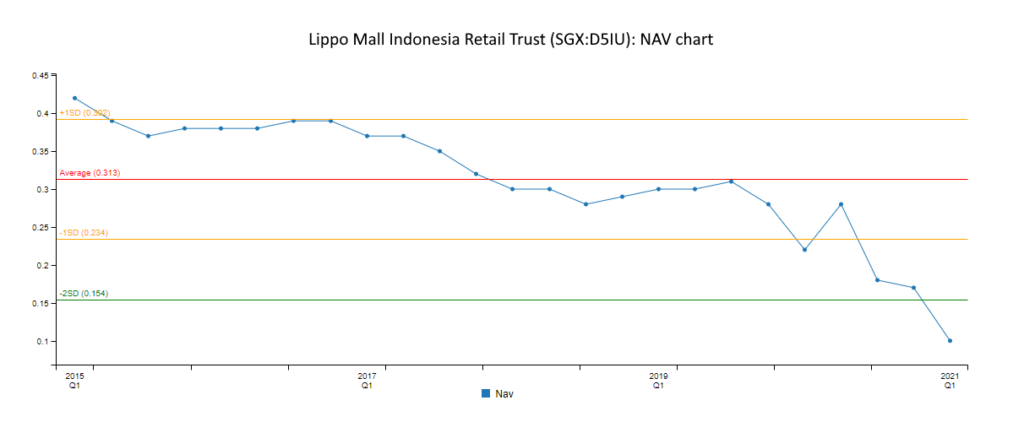
Lippo Malls Indonesia Retail Trust


LMIR Trust comprises 29 Retail properties, wholly in Indonesia, with a total portfolio valuation of S$1,791.5 million. Its NAV decreased from 0.42 in Q1 2015 to 0.10 in Q1 2021. LMIR Trust held a right issue in Q1 2021.
Sabana REIT


Sabana REIT comprises 18 industrial properties, wholly in Singapore, with a total portfolio valuation of S$840.1 million. Its NAV decreased from 1.06 in Q1 2015 to 0.51 in Q1 2021. although its NAV remained relatively stable, hovering around 0.55, since Q1 2017.
First REIT


First REIT comprises 20 healthcare properties comprising 16 hospitals located in Indonesia, three nursing homes in Singapore, and one hospital in South Korea. Its total portfolio valuation is S$939.7 million. Its NAV remained stable until Q4 2020, where a rights issue was carried out, dropping its NAV to 0.50.
OUE Commercial REIT


OUE Commercial REIT’s portfolio comprises seven properties in the Office, Retail and Hospitality sectors, with properties in Singapore and Shanghai, and a total portfolio valuation of S$6,524.8 million. Its NAV decreased from 1.11 in Q1 2015 to 0.58 in Q1 2021.
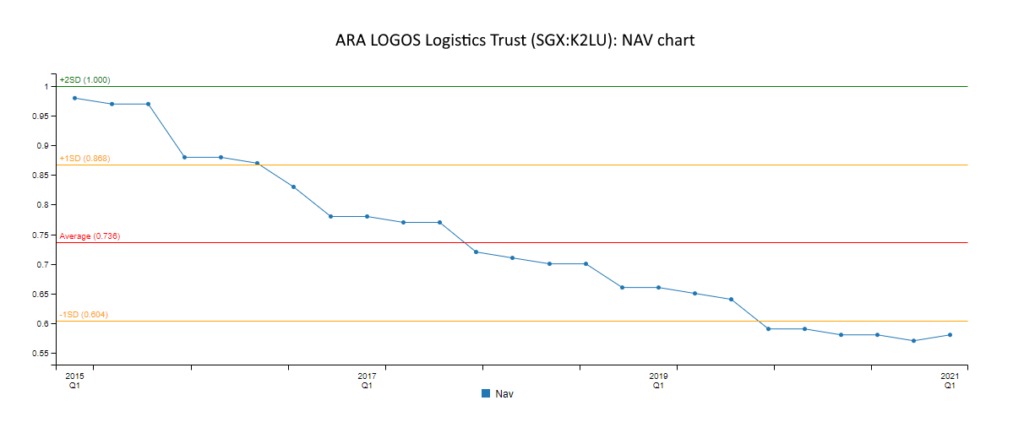
ARA LOGOS Logistics Trust


ARA LOGOS Logistics Trust (formerly Cache Logistics Trust) portfolio comprises 31 logistics warehouse properties, with 10 located in Singapore and 21 located in Australia. Its NAV decreased from 0.98 in Q1 2015 to 0.58 in Q1 2021. In Q1 2020, ARA Asset Management completed the acquisition of a majority stake in LOGOS, and Cache Logistics Trust was renamed to its current name.
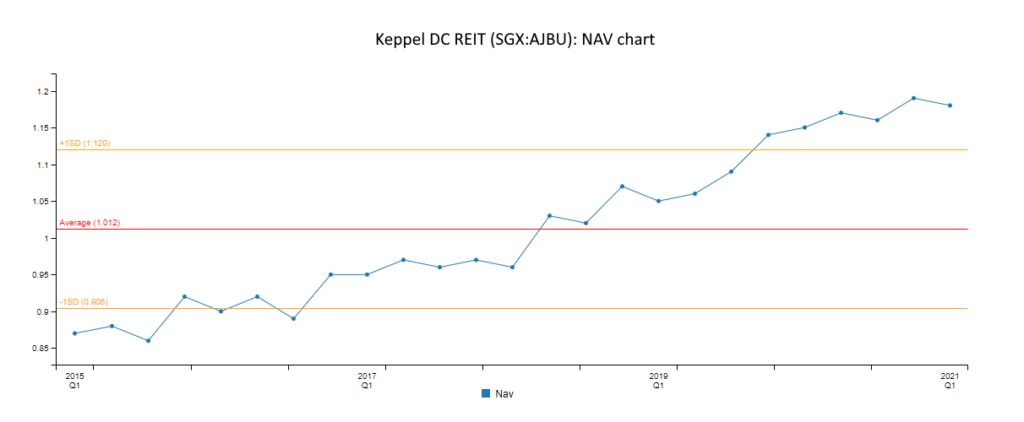
As there are REITs with a decreasing NAV trend, there are also REITs with an increasing NAV trend for the past 5 years. This is beneficial for us investors, as when NAV increases, so does the share price. An example is Keppel DC REIT.

Its NAV increased from 0.87 in Q1 2015 to 1.18 in Q1 2021, an increase of 35.59%. So does its price, which has also seen a large increase from S$0.96 in Q1 2015 (taken 2 Jan 2015) to S$2.58, increasing by 168%.

There are other REITs that have an increasing NAV trend. You can find other REITs with increasing NAV trends in the StocksCafe REIT screener. Happy hunting!
Kenny Loh is a Senior Consultant and REITs Specialist of Singapore’s top Independent Financial Advisor. He helps clients construct diversified portfolios consisting of different asset classes from REITs, Equities, Bonds, ETFs, Unit Trusts, Private Equity, Alternative Investments, Digital Assets and Fixed Maturity Funds to achieve an optimal risk adjusted return. Kenny is also a CERTIFIED FINANCIAL PLANNER, SGX Academy REIT Trainer, Certified IBF Trainer of Associate REIT Investment Advisor (ARIA) and also an invited speaker of REITs Symposium and Invest Fair. Kenny Loh also offers REIT Portfolio Advisory for a fee. Do contact him at kennyloh@fapl.sg
