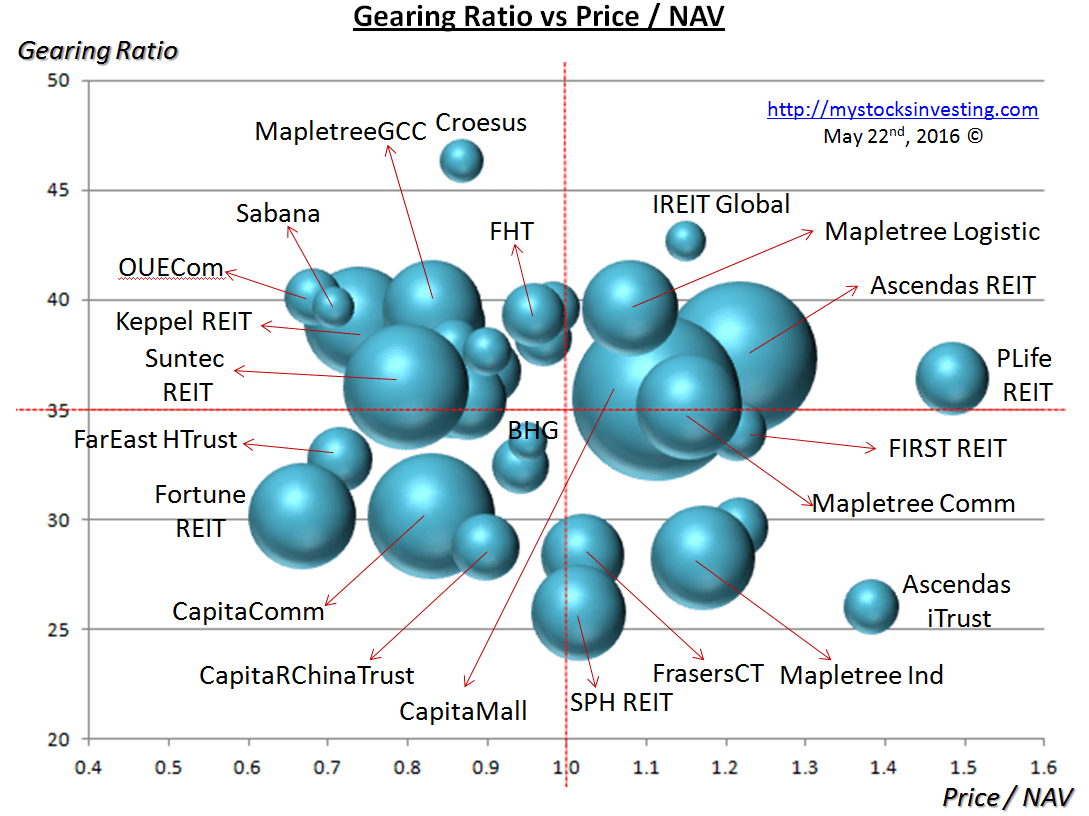
Bubble chart derived from May 1, 2016 Singapore REITs Fundamental Comparison Table. Compare to previous Singapore REIT Bubble Chart, distribution yield for big market capitalization Singapore REITs like Capitaland MallTrust, Capitaland Commercial Trust, Suntec REIT have dropped.
These Bubble Charts are used to show the “relative” position compare to other Singapore REITs.
Two visual bubble charts to pick and avoid:
- Undervalue Singapore REITs with High Distribution Yield** (Value Pick)
- Overvalue Singapore REITs with High Gearing Ratio (Risk Avoidance)
** Distribution Yield are lagging.
** Update: Change the Distribution Yield % criteria from 5% to 6%.


