Singapore REIT Fundamental Analysis Comparison Table – 1 April 2019
Technical Analysis of FTSE ST REIT Index (FSTAS8670)
FTSE ST Real Estate Investment Trusts (FTSE ST REIT Index) continued the bullish rally raising from 842.91 to 866.27 (+2.77%) as compared to last post on Singapore REIT Fundamental Comparison Table on Mar 4, 2019.

The REIT index continues to rise sharply in the uptrend and currently closing in the immediate resistance of 875 (the previous high in 2018). Based on the current chart pattern and and momentum, the trend for Singapore REIT direction is UP but upside may be limited. It remains to be seen whether the REIT index can break the 2018 high (875) and 2013 high (892) back in May 2013. We shall see whether the following fundamental REIT data to support the technical bull run.
Fundamental Analysis of 39 Singapore REITs
The following is the compilation of 39 REITs in Singapore with colour coding of the Distribution Yield, Gearing Ratio and Price to NAV Ratio. This gives investors a quick glance of which REITs are attractive enough to have an in-depth analysis. There are currently 39 REITs in Singapore after VIVA Industrial Trust merged into ESR REIT.

- Price/NAV increase from 1.01 to 1.03 (Singapore Overall REIT sector is slightly value now).
- Distribution Yield decreases from 6.59% to 6.47% (take note that this is lagging number). About 35.9% of Singapore REITs (14 out of 39) have Distribution Yield > 7%.
- Gearing Ratio stays at 34.7%. 21 out of 39 have Gearing Ratio more than 35%. In general, Singapore REITs sector gearing ratio is healthy. Note: The limit of gearing ratio for REITs listed in Singapore Stock Exchange is 45%.
- The most overvalue REIT is Parkway Life (Price/NAV = 1.58), followed by Keppel DC REIT (Price/NAV = 1.40), Mapletree Industrial Trust (Price/NAV = 1.42) and Ascendas REIT (Price/NAV = 1.42).
- The most undervalue (base on NAV) is Fortune REIT (Price/NAV = 0.61), followed by OUE Comm REIT (Price/NAV = 0.73), Lippo Mall Indonesia Retail Trust (Price/NAV = 0.69) and Sabana REIT (Price/NAV = 0.75).
- The Highest Distribution Yield (TTM) is Lippo Mall Indonesia Retail Trust (10.41%), followed by Keppel KBS US REIT (8.46%), SoilBuild BizREIT (8.59%), First REIT (8.69%), EC World REIT (8.13%) and Cromwell European REIT (8.37%).
- The Highest Gearing Ratio are ESR REIT (41.9%), Far East HTrust (40.1%) and OUE Comm REIT (39.3%) and Mapletree NAC Trust (39%)
Disclaimer: The above table is best used for “screening and shortlisting only”. It is NOT for investing (Buy / Sell) decision. To learn how to use the table and make investing decision, Sign up next REIT Investing Seminar here to learn how to choose a fundamentally strong REIT for long term investing for passive income generation.

- 1 month increases from 1.81742% to 1.82608%
- 3 month decreases from 1.94558% to 1.94405%
- 6 month decreases from 2.00083% to 2.00034%
- 12 month decreases from 2.15373% to 2.15188%
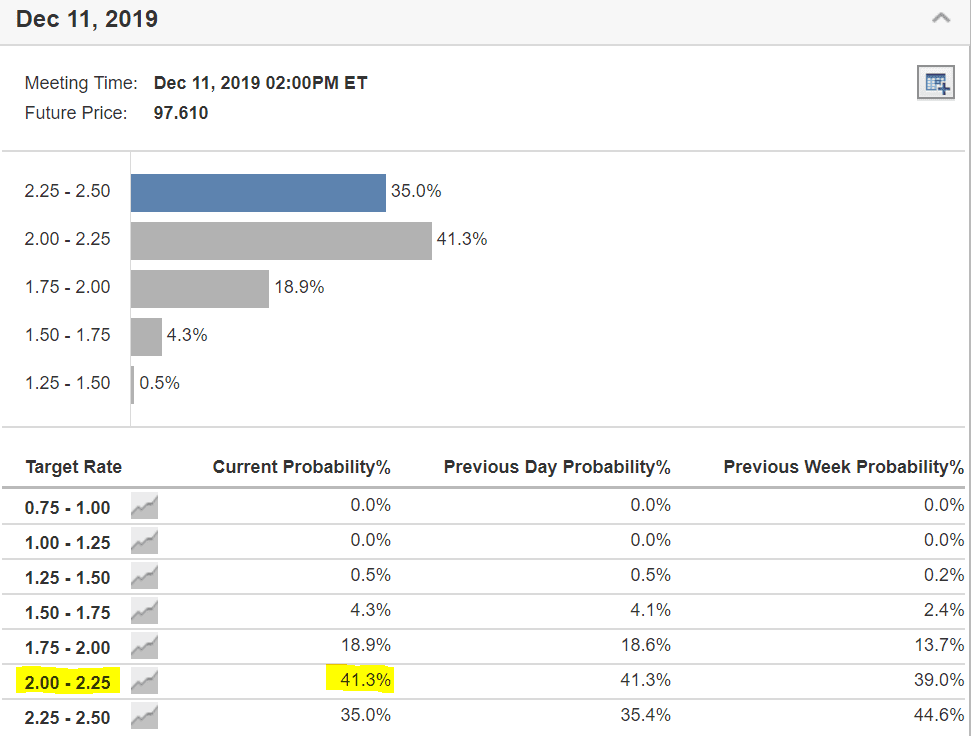
Based on current probability of Fed Rate Monitor, the US Fed Reserve may cut 25 bps to 2.25% in 2019.
Summary
Fundamentally the whole Singapore REITs is slightly over value now. The big cap REITs are getting expensive and the distribution yield are not so attractive currently. The yield spread between big cap and small cap REIT remains wide. This indicates value picks only in small and medium cap REITs. For reference, 10-years risk free yield rate for latest Singapore Saving Bonds is 2.16%.
Yield spread (reference to 10 year Singapore government bond (2.08%) has widened from to 4.35% to 4.39%. DPU yield for a number of small and mid-cap REITs are still very attractive (>8%) at the moment. It is expected the next move would be on small and medium size REITs due to higher risk premium compared to big cap REITs.
Technically, the REIT index is trading in a bullish uptrend but it is expected to have a short term pause before moving higher. Immediate resistance at 875 followed by 892. Singapore REIT index may have a chance to break the previous high if the US Fed Reserve cut interest rate further unexpectedly. Current bullish trend in Singapore REIT index may have priced in the possible 25 bps rate cut in 2019.
If you are REIT investors, it is strongly recommended to attend the coming Singapore REITs Symposium on May 18. First 30 signups via promo code (msinvesting) will be entitled to a mystery gift and it’s redeemable on ground at ShareInvestor’s booth. Click the REITs Symposium here to register. http://www.reitsymposium.com/index.html


Relevant posts:
- Summary of 1st half 2019 Singapore REIT market outlook session, a private event organised for my REIT class students.
- Risk Free Investment Tips for Newbie Investors
If you need an independent professional review on your current REIT portfolio and need any recommendation, you may engage me in the REIT portfolio Advisory. REITs Portfolio Advisory. https://mystocksinvesting.com/course/private-portfolio-review/