Singapore REIT Fundamental Analysis Comparison Table – 1 July 2018

  • Post author:

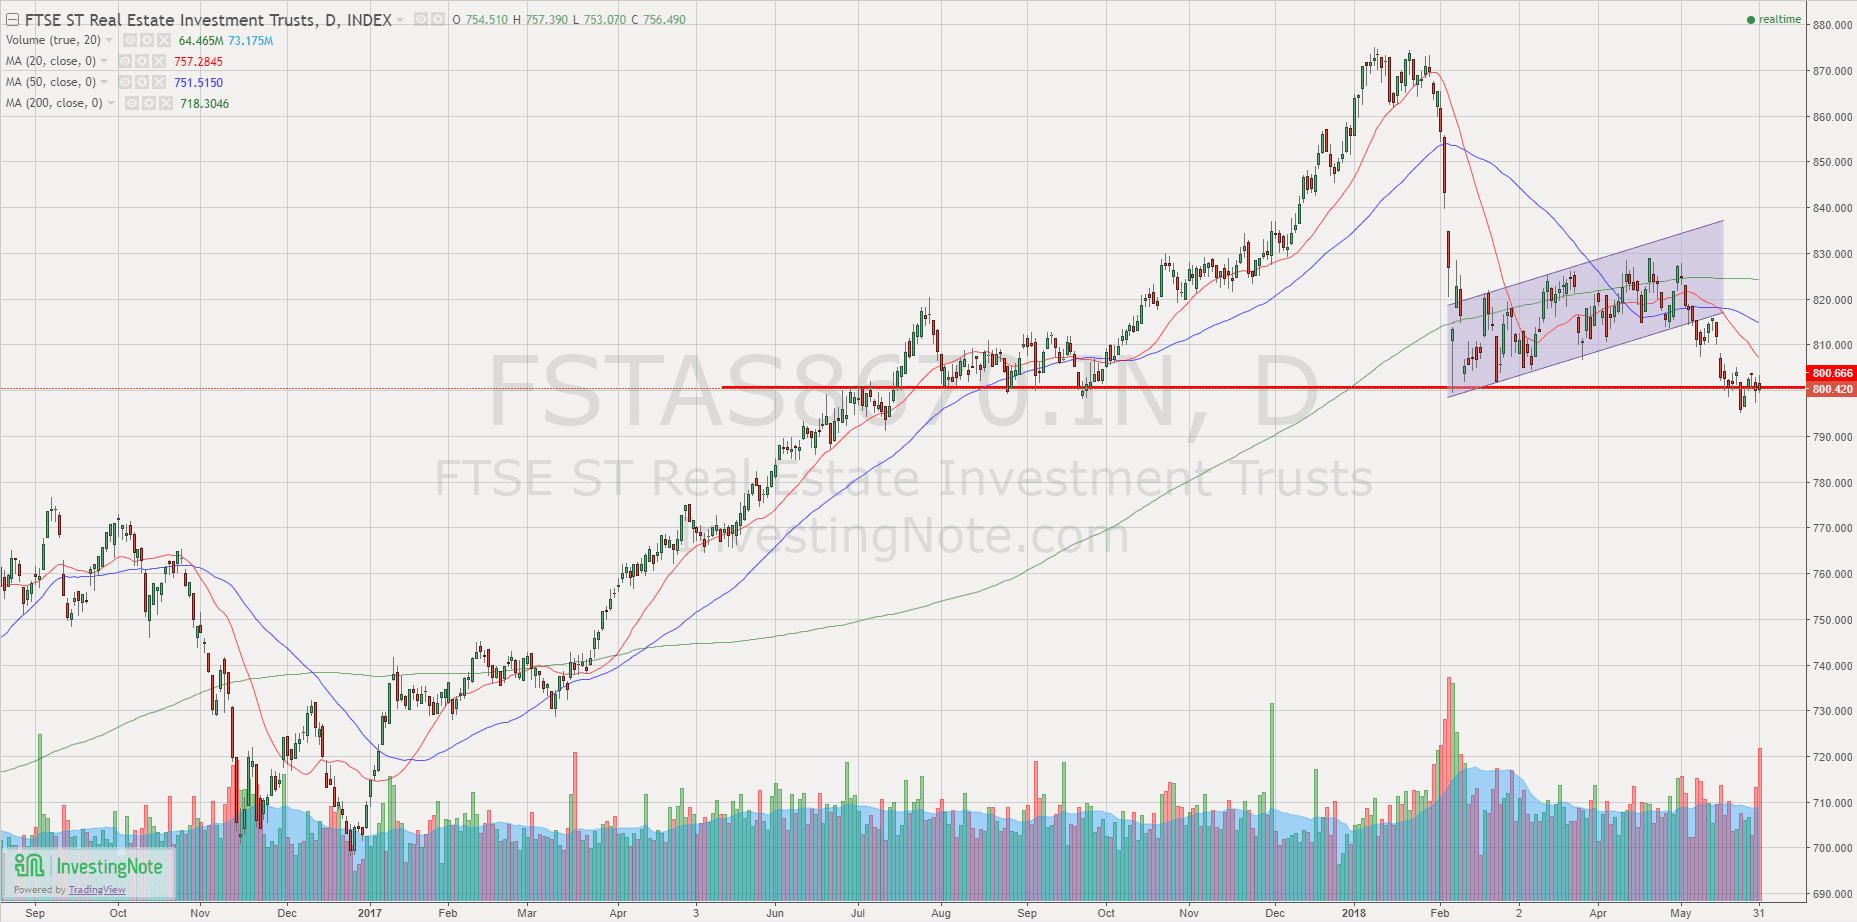
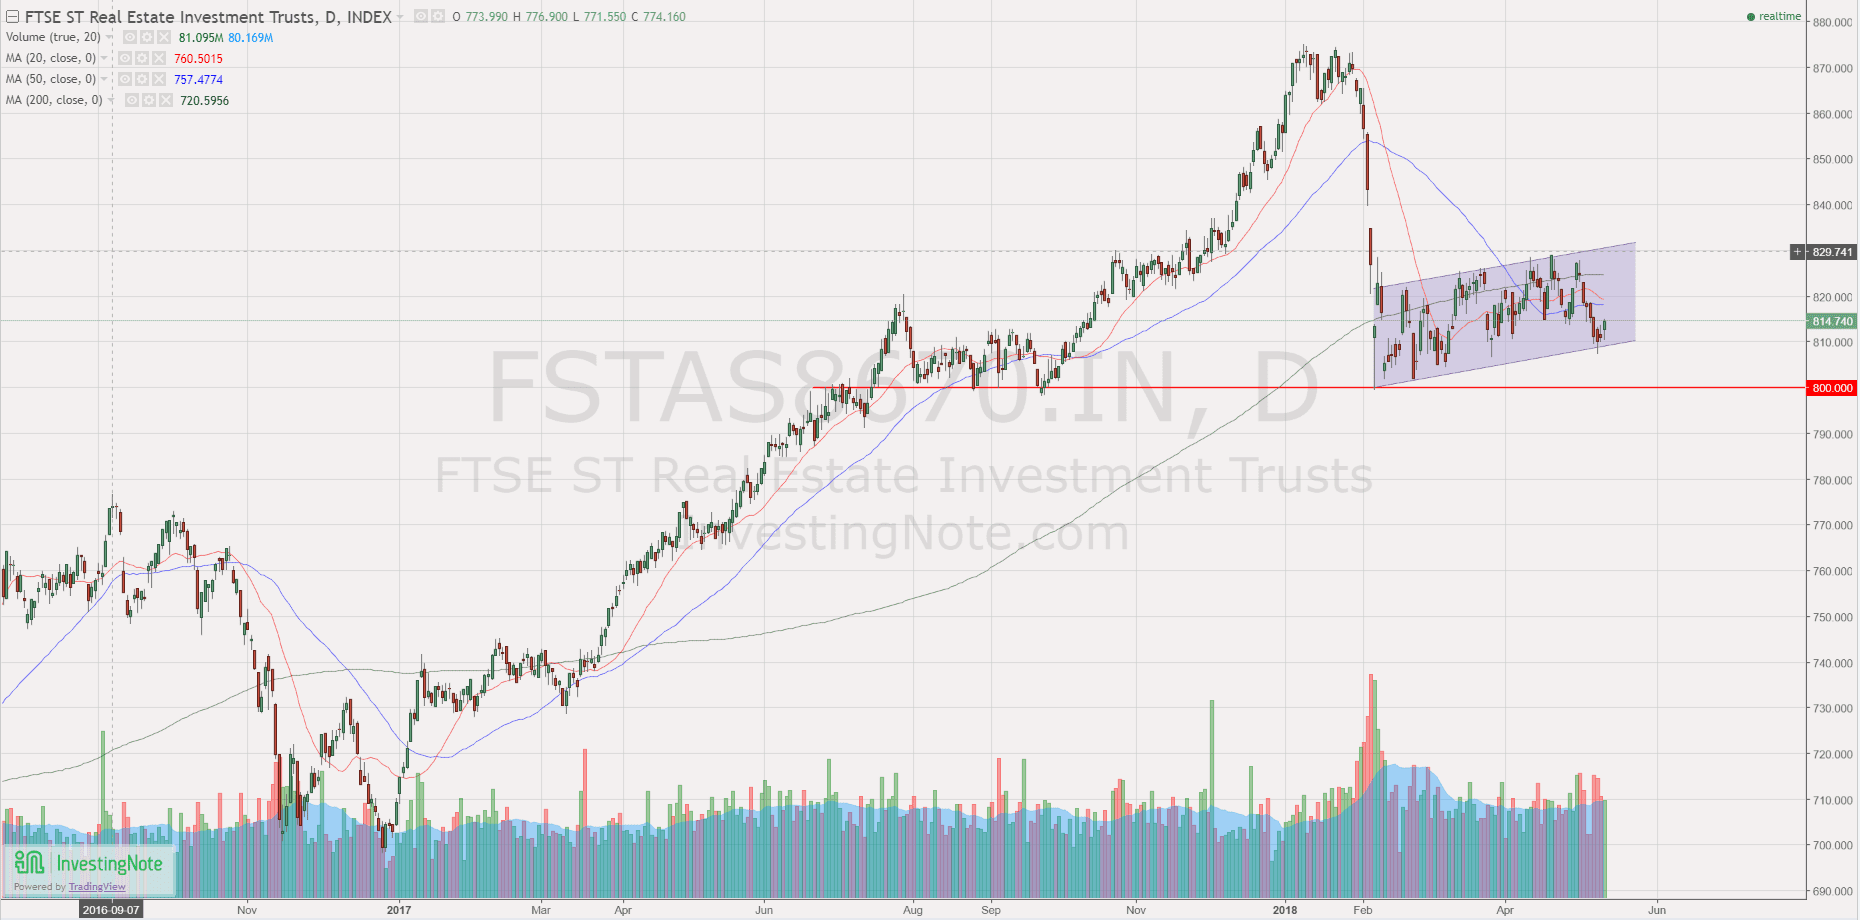
FTSE ST Real Estate Investment Trusts (FTSE ST REIT Index) decreases from  800.42 to 786.10 (-1.79%) as compared to last post on Singapore REIT Fundamental Comparison Table on June 1, 2018.  The REIT index has broken the 800 support and all 3 Moving Averages are turning down. This is a signal of bearish down trend.   The REIT Index has rebounded from a Resistance Turned Support and is currently testing the 20D SMA resistance. If this support zone is broken, the REIT index will continue to slide down to around 742 level.

Fundamental Analysis

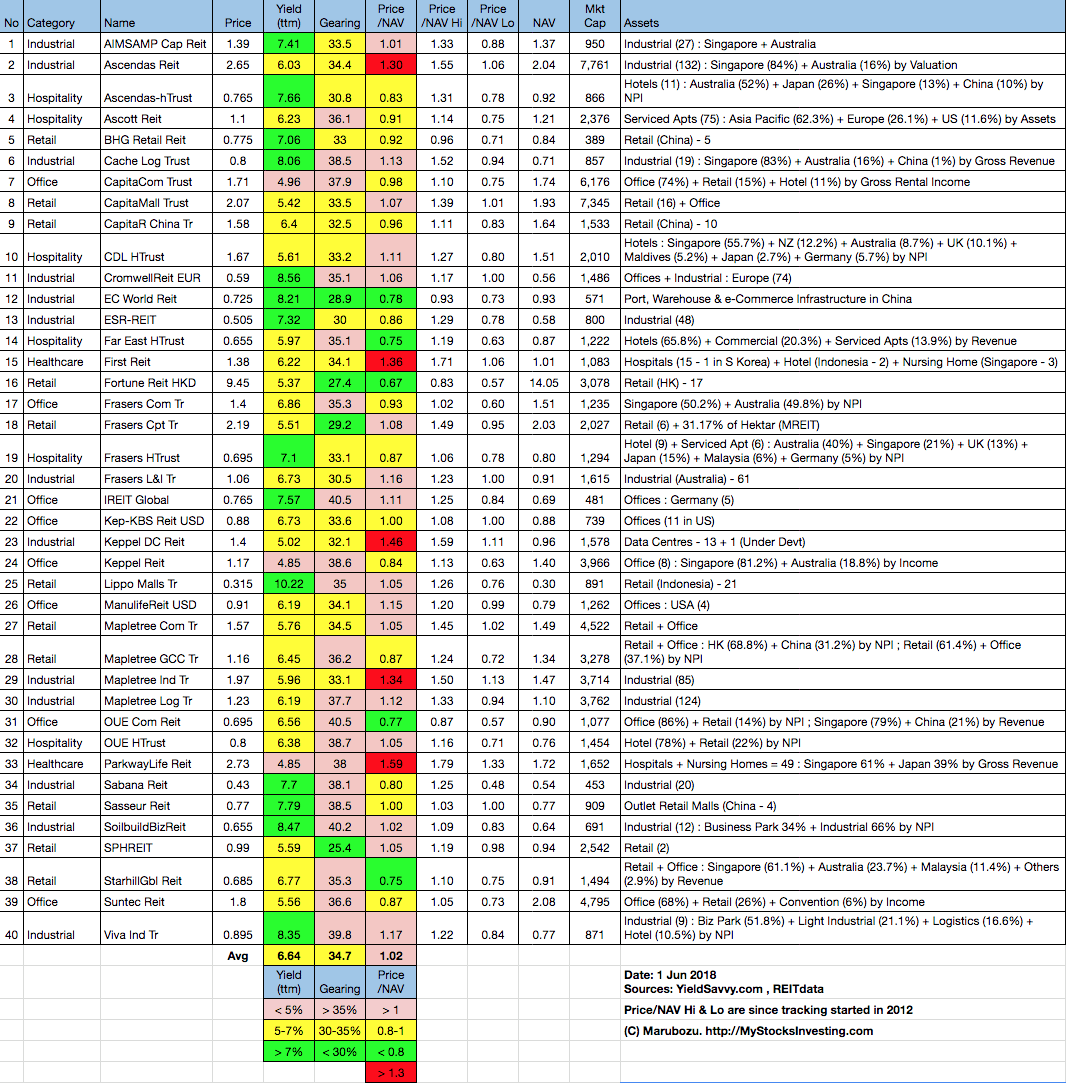
  • Price/NAV decreases from 1.02 to 1.00 (Singapore Overall REIT sector is at fair value now).
  • Distribution Yield increases from 6.64% to 6.76% (take note that this is lagging number). About one third of Singapore REITs (15 out of 40) have Distribution Yield > 7%.
  • Gearing Ratio stays at 34.7%.  20 out of 40 have Gearing Ratio more than 35%. In general, Singapore REITs sector gearing ratio is healthy.
  • Most overvalue REIT is Parkway Life (Price/NAV = 1.58), followed by Keppel DC REIT (Price/NAV = 1.42), First REIT (Price/NAV = 1.31) and Mapletree Industrial Trust (Price/NAV = 1.31).
  • Most undervalue (base on NAV) is Fortune REIT (Price/NAV = 0.65), followed by  Starhill Global REIT (Price/NAV = 0.71), Far East Hospitality Trust (Price/NAV = 0.73), OUE Comm REIT (Price/NAV = 0.76) and EC World REIT (Price/NAV = 0.77).
  • Highest Distribution Yield (TTM) is Lippo Mall Indonesia Retail Trust (10.22%), followed by SoilBuild BizREIT (8.53%), Viva Industrial Trust (8.54%), Cromwell European REIT (8.49%), EC World REIT (8.27%), Sasseur REIT (8.22%) and Cache Logistic Trust (8.37%).
  • Highest Gearing Ratio are OUE Comm REIT (40.5%), iREIT Global (40.5%) and Soilbuild BizREIT (40.2%).

Disclaimer: The above table is best used for “screening and shortlisting only”. It is NOT for investing (Buy / Sell) decision. To learn how to use the table and make investing decision, Sign up next REIT Investing Seminar here to learn how to choose a fundamentally strong REIT for long term investing for passive income generation.

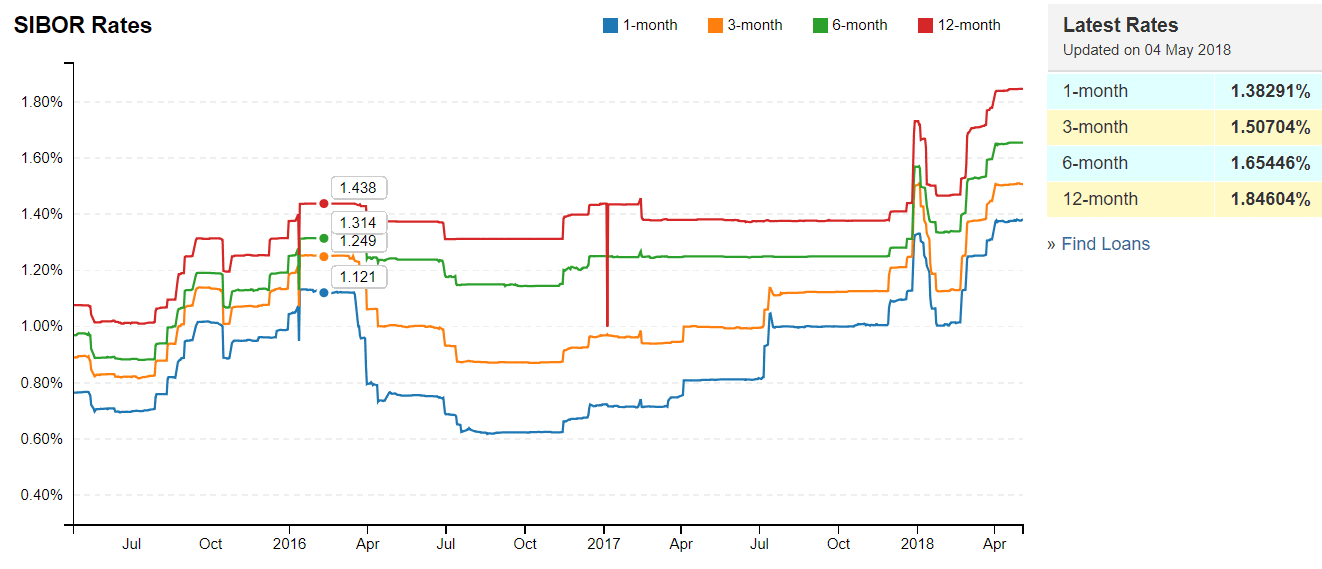
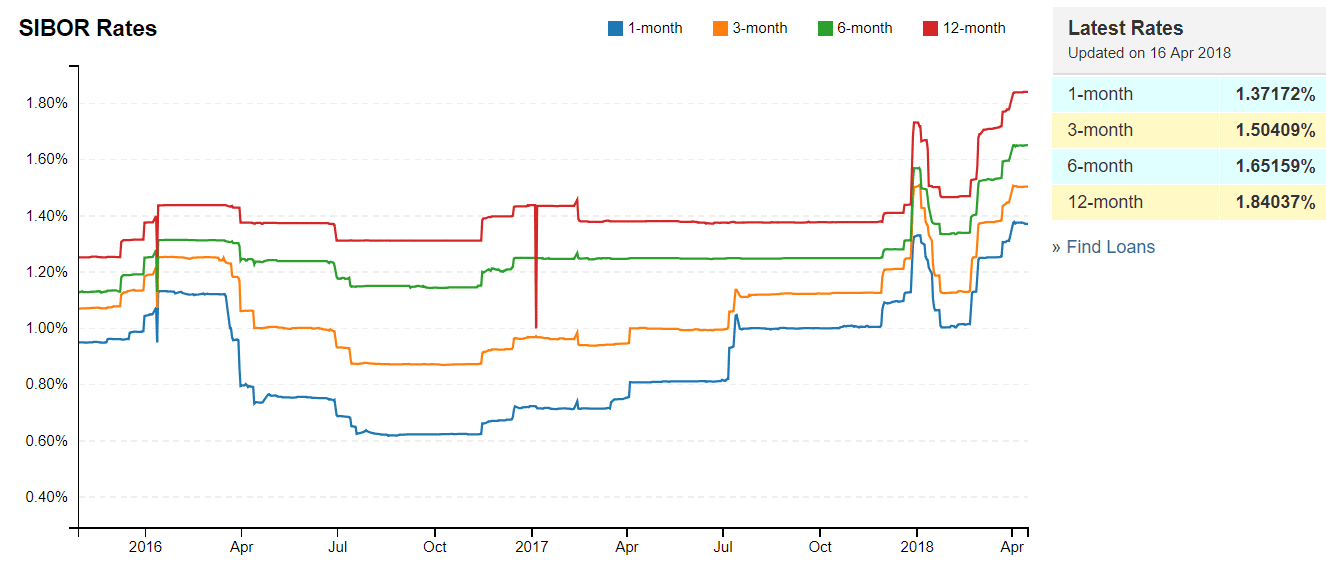
  • 1 month increases from 1.38291% to 1.40050%
  • 3 month increases from 1.50704% to 1.52038%
  • 6 month increases from 1.65446% to 1.66171%
  • 12 month increases from 1.84604% to 1.85065%

Summary

Fundamentally the whole Singapore REITs is at fair value now.  Overall yield for Singapore REIT is still attractive (average yield of 6.76%). Yield spread (reference to 10 year Singapore government bond) is 4.23%. DPU yield for a number of small and mid cap REITs are quite attractive at the moment.  However, technically, the REIT index is currently trading on downtrend and more down side is expected in the near term. It is time to get our watch list ready if the REIT sectors continue to correct to an attractive entry level.


REIT in Singapore is considered a Listed Alternative Investment. I will be inviting Sani Hamid to give a current market outlook and share his strategy on How to Safeguard Your Portfolio Using Regulated Alternative Investment.  This is an exclusive private event for my blog readers, my students and my guests. Registration is compulsory as seats are limited. Please register online here https://www.eventbrite.sg/e/how-to-safeguard-your-portfolio-using-regulated-alternative-investments-tickets-47455131576


See all other relevant  Singapore REITs blog posts here.

If you need an independent professional review on your current REIT portfolio and need any recommendation, you may engage me in the REIT portfolio Advisory. REITs Portfolio Advisory.  https://mystocksinvesting.com/course/private-portfolio-review/

Continue ReadingSingapore REIT Fundamental Analysis Comparison Table – 1 July 2018

Singapore REIT Fundamental Analysis Comparison Table – 1 June 2018

  • Post author:

FTSE ST Real Estate Investment Trusts (FTSE ST REIT Index) decreases from  814.74 to 800.42 (-1.76%) as compared to last post on Singapore REIT Fundamental Comparison Table on May 13, 2018.  The REIT index has broken the bearish flag pattern and starts the down trend. Both 20D and 50D SMA has already crossed down 200D SMA and trending downward.  Currently the REIT index is just hanging on to 800 support.  Further down side is expected if a huge bearish candle is seen trading below this 800 level. We welcome the Bear visits Singapore REIT sector!


Fundamental Analysis


  • Price/NAV decreases from to 1.02 (Singapore Overall REIT sector near to the fair value).
  • Distribution Yield increases from 6.55% to 6.64% (take note that this is lagging number). About one third of Singapore REITs (14 out of 40) have Distribution Yield > 7%.
  • Gearing Ratio stays at 34.7%.  20 out of 40 have Gearing Ratio more than 35%. In general, Singapore REITs sector gearing ratio is healthy.
  • Most overvalue REIT is Parkway Life (Price/NAV = 1.59), followed by Keppel DC REIT (Price/NAV = 1.46), First REIT (Price/NAV = 1.36) and Mapletree Industrial Trust (Price/NAV = 1.34).
  • Most undervalue (base on NAV) is Fortune REIT (Price/NAV = 0.67), followed by OUE Comm REIT (Price/NAV = 0.77), Far East Hospitality Trust (Price/NAV = 0.75), EC World REIT (Price/NAV = 0.78) and Starhill Global REIT (Price/NAV = 0.75).
  • Highest Distribution Yield (TTM) is Lippo Mall Indonesia Retail Trust (10.22%), followed by SoilBuild BizREIT (8.47%), Viva Industrial Trust (8.35%), Cromwell European REIT (8.56%), EC World REIT (8.21%), and Cache Logistic Trust (8.06%).
  • Highest Gearing Ratio are OUE Comm REIT (40.5%), iREIT Global (40.5%) and Soilbuild BizREIT (40.2%).

Disclaimer: The above table is best used for “screening and shortlisting only”. It is NOT for investing (Buy / Sell) decision. To learn how to use the table and make investing decision, Sign up next REIT Investing Seminar here to learn how to choose a fundamentally strong REIT for long term investing for passive income generation.

  • 1 month increases from 1.37172% to 1.38291%
  • 3 month increases from 1.50409% to 1.50704%
  • 6 month increases from 1.65159% to 1.65446%
  • 12 month increases from 1.84037% to 1.84604%


Summary

Fundamentally the whole Singapore REITs is getting near to fair value.  Overall yield for Singapore REIT is still attractive (average yield of 6.64%). However, technically, the REIT index is currently trading on downtrend after breaking down from the bear flag. More down side is expected in the near term. It is time to get our watch list ready if the REIT sectors continue to correct to an attractive entry level.

I will be sharing my analysis on the correlation of US interest rate hike vs REIT sector performance in coming public workshop on June 7, 2018 and 2H Singapore REIT market update sometimes in July. Do subscribe to my mailing list https://mystocksinvesting.com/mailinglist/ if you want to have 1st notification when the registration starts, or check out the workshop / seminar detail here https://mystocksinvesting.com/events/.

If you need an independent professional review on your current REIT portfolio and need any recommendation, you may engage me in the REIT portfolio Advisory. REITs Portfolio Advisory.  https://mystocksinvesting.com/course/private-portfolio-review/


See all other relevant  Singapore REITs blog posts here.


Continue ReadingSingapore REIT Fundamental Analysis Comparison Table – 1 June 2018

Singapore REIT Fundamental Analysis Comparison Table – 13 May 2018

  • Post author:

FTSE ST Real Estate Investment Trusts (FTSE ST REIT Index) decreases slightly from  818.49 to 814.74 (-0.46%) as compared to last post on Singapore REIT Fundamental Comparison Table on April 1, 2018.  The REIT index is consolidating in a Bear Flag pattern for past 3 months. A new bearish trend will start if the FTSE ST REIT Index breaks the 800 support. Breaking down this Bear Flag will send the REIT index down to target zone of 760-770. Both 20D and 50D SMA has already crossed down 200D SMA.  These are all bearish signals which may launch the REIT index to full down trend unless the REIT index break the Flag resistance to invalid this bearish chart pattern.

Fundamental Analysis

  • Price/NAV decreases from 1.06 to 1.03 (Singapore Overall REIT sector is still over value).
  • Distribution Yield increases from 6.47% to 6.55% (take note that this is lagging number). About one third of Singapore REITs (12 out of 40) have Distribution Yield > 7%.
  • Gearing Ratio reduces from 34.8% to 34.7%.  20 out of 40 have Gearing Ratio more than 35%. In general, Singapore REITs sector gearing ratio is healthy.
  • Most overvalue REIT is Parkway Life (Price/NAV = 1.60), followed by Keppel DC REIT (Price/NAV = 1.43), First REIT (Price/NAV = 1.34) and Mapletree Industrial Trust (Price/NAV = 1.35).
  • Most undervalue (base on NAV) is Fortune REIT (Price/NAV = 0.66), followed by OUE Comm REIT (Price/NAV = 0.80), Sabana REIT (Price/NAV = 0.79) and Starhill Global REIT (Price/NAV = 0.75).
  • Highest Distribution Yield (TTM) is Lippo Mall Indonesia Retail Trust (10.06%), followed by SoilBuild BizREIT (8.47%), Viva Industrial Trust (8.40%), Cromwell REIT (8.15%), EC World REIT (8.04%), and Cache Logistic Trust (8.06%).
  • Highest Gearing Ratio are OUE Comm REIT (40.5%), iREIT Global (40.5%) and Soilbuild BizREIT (40.2%).

Disclaimer: The above table is best used for “screening and shortlisting only”. It is NOT for investing (Buy / Sell) decision. To learn how to use the table and make investing decision, Sign up next REIT Investing Seminar here to learn how to choose a fundamentally strong REIT for long term investing for passive income generation.

  • 1 month increases from 1.25250% to 1.37172%
  • 3 month increases from 1.37733% to 1.50409%
  • 6 month increases from 1.53101% to 1.65159%
  • 12 month increases from 1.70876% to 1.84037%

Based on the Fed Rate Monitor Tool by Investing.com, there is 100% probability US Fed is going to raise the interest rate by another 25 bps to 1.75 – 2%.

Summary

Fundamentally the whole Singapore REITs is still over value now after the sell off in February.  Overall yield for Singapore REIT is still attractive (average yield of 6.55%). However, technically, the REIT index is consolidating in a Bear Flag chart pattern.  The index may have another big move down if the support of the Bear Flag is broken.

Another thing to take note is the US Fed Interest Rate hike will cause fund managers to rotate their money out of the REIT sector. I have shown my analysis (US interest rate hike vs REIT sector performance) in my private investors workshop.  I will be sharing this analysis in my coming 2H Singapore REIT market update sometimes in June / July. Do subscribe to my mailing list https://mystocksinvesting.com/mailinglist/ if you want to have 1st notification when the registration starts.


What Should You Do?

  • If you are holding any big REIT position, you may want to reduce your exposure or hedge your portfolio. You have to proactively manage (making decision logically) your portfolio instead of reacting to the event (emotion takes over) when things happen. Be prepared for another huge leg down if the technical support is broken.
  • If you do not have any REIT now but want to build up your REIT portfolio for passive income, it is time to do homework now to put fundamental strong REIT into your watch list. You can do a great shopping when there is panic selling.
  • I receive many emails asking me when is my next REIT class.  The tentative date is on June 16 & 17 but I will still working on the logistic and registration detail.  I would suggest you subscribe through my mailing list to be kept posted on the next REIT class schedule. https://mystocksinvesting.com/course/singapore-reits-investing/
  • If you need an independent professional review on your current REIT portfolio and need any recommendation, you may engage me in the REIT portfolio Advisory. REITs Portfolio Advisory.  https://mystocksinvesting.com/course/private-portfolio-review/


See all other relevant  Singapore REITs blog posts here.

Continue ReadingSingapore REIT Fundamental Analysis Comparison Table – 13 May 2018