Centurion Accomodation REIT IPO: Prospectus & Summary
I attended the Analyst Presentation for Centurion Accommodation REIT on 19 September 2025, where I had the opportunity to engage with both the CEO and CFO. It was an insightful session that offered valuable perspectives on the REIT’s strategy and growth outlook.

Overview
Centurion Accommodation REIT (CAREIT) is launching an initial public offering (IPO) on the SGX Mainboard to raise approximately S$771.1 million, marking Singapore’s first pure-play purpose-built living accommodation REIT. The Offering consists of 262.2 million units priced at S$0.88 per unit for investors. Cornerstone investors, including global and regional real estate funds and long-only institutions such as FIL Investment Management, abrdn Asia, UBS, Eastspring, and others, have subscribed to 614.0 million units (35.7%) of the total issued units.
The Sponsor, Centurion Corporation Limited, will retain a significant stake of ~45.8% post-IPO (assuming no over-allotment). Trading of the units is expected to commence on 25 September 2025 at 2:00 p.m.
Prospectus | Product Highlights Sheet
Fundamental and Financial Ratios
- Type: Purpose-Built Workers Accommodation (PBWA) & Purpose-Built Student Accommodation (PBSA)
- Sponsor: Centurion Corporation Limited
- REIT Manager: Centurion Asset Management Pte. Ltd.
- Total Units in Issue: ~1.72 billion (post-IPO, including cornerstone units)
- Units Offered: 262,160,900 (Placement & Public Offer, excluding cornerstone tranche)
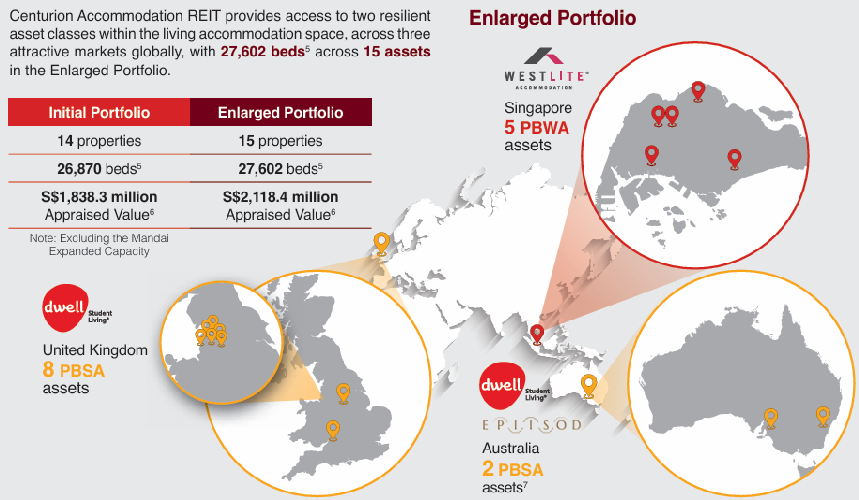
- Portfolio: 14 properties initially, expanding to 15 with EPIISOD Macquarie Park
- Geographic Presence: Singapore, United Kingdom, Australia
- Portfolio Size: S$1.84 billion (Initial Portfolio); S$2.12 billion (Enlarged Portfolio)
- IPO Offer Price: S$0.88 per unit
- NAV per Unit: ~S$0.84 (calculated)
- Price / NAV: ~1.05x (approx.)
- Gearing Ratio: 20.9% (IPO, Initial Portfolio); ~31.0% (post EPIISOD acquisition)
- Forecasted Distribution Yield: 7.47% (FY2026), 8.11% (FY2027)
- Distribution Policy: 100% of distributable income (initial years); semi-annual distributions
Lease Management Ratios
- Occupancy (PBWA): 97.9% average (FY2022–FY2024)
- Occupancy (PBSA): 94.1% average (FY2022–FY2024)
- Tenant Retention (PBWA): ~85.2%
- Brands: Westlite (PBWA), Dwell and EPIISOD (PBSA)
- Rental Growth CAGR: 26.3% (PBWA, FY2022–2024), 11.3% (PBSA, FY2022–2024)
Debt Management Ratios
- Aggregate Leverage: 20.9% post-IPO; ~31.0% post-EPIISOD acquisition
- Interest Coverage Ratio (ICR): 4.7x, 6.7x, 7.1x*
- Interest/Debt Cost: 4.16%, 4.12%, 4.11%*
- Debt Maturity: No maturities in the first 2 years; earliest in 2028
IPO Information
- IPO Offer Price: S$0.88 per unit
- Offer Closing Date: 23 September 2025, 12:00 p.m.
- Listing Date: 25 September 2025, 2:00 p.m.
*Forecast Period 2025, Projection Year 2026 and Projection Year 2027 respectively
Portfolio Overview
With the acquisition of Epiisod Macquarie Park in Sydney, the Enlarged Portfolio will expand to 15 properties valued at ~S$2.12 billion, offering 27,602 beds across three markets.
The REIT targets resilient demand from Singapore’s foreign worker housing market and the UK/Australia student housing sectors, all of which face supply constraints and steady rental growth. CAREIT is positioned for both organic growth (asset enhancements, rental escalations) and inorganic expansion (via Sponsor’s right-of-first-refusal pipeline).


Kenny Loh is a distinguished Wealth Advisory Director with a specialization in holistic investment planning and estate management. He excels in assisting clients to grow their investment capital and establish passive income streams for retirement. Kenny also facilitates tax-efficient portfolio transfers to beneficiaries, ensuring tax-efficient capital appreciation through risk mitigation approaches and optimized wealth transfer through strategic asset structuring.
In addition to his advisory role, Kenny is an esteemed SGX Academy trainer specializing in S-REIT investing and regularly shares his insights on MoneyFM 89.3. He holds the titles of Certified Estate & Legacy Planning Consultant and CERTIFIED FINANCIAL PLANNER (CFP).
With over a decade of experience in holistic estate planning, Kenny employs a unique “3-in-1 Will, LPA, and Standby Trust” solution to address clients’ social considerations, legal obligations, emotional needs, and family harmony. He holds double master’s degrees in Business Administration and Electrical Engineering, and is an Associate Estate Planning Practitioner (AEPP), a designation jointly awarded by The Society of Will Writers & Estate Planning Practitioners (SWWEPP) of the United Kingdom and Estate Planning Practitioner Limited (EPPL), the accreditation body for Asia.
You can join his Telegram channel #REITirement – SREIT Singapore REIT Market Update and Retirement related news. https://t.me/REITirement

 Refer to the