Is Your REIT Dividend a Mirage? 5 Red Flags Hiding Behind a High DPU

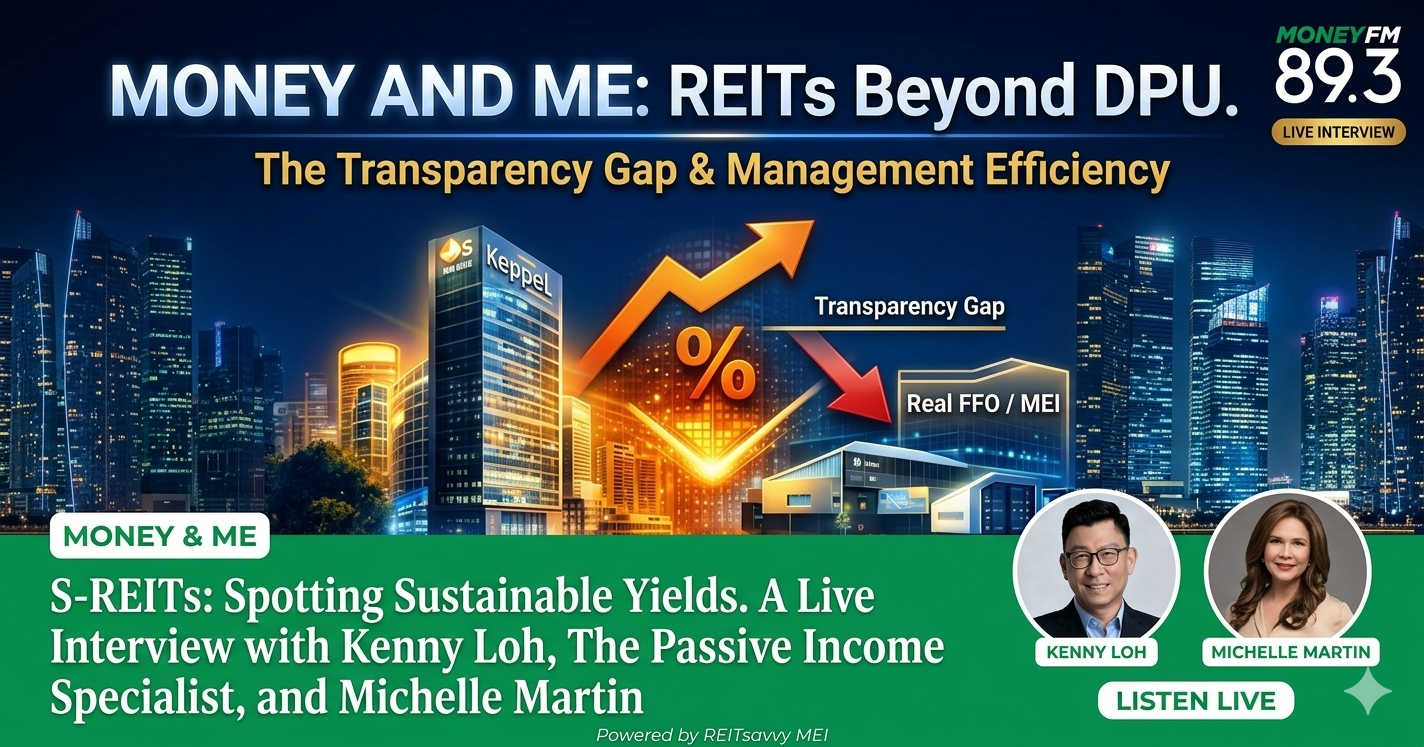
For many retail investors, the headline Distribution Per Unit (DPU) is the ultimate scorecard. It is the number that flashes on the screen, dictates the yield, and often determines whether a REIT earns a place in a retirement portfolio. However, as REIT specialist Kenny Loh warns, focusing exclusively on this headline figure can lead to a dangerous “Transparency Gap.”
The headline DPU is often the financial equivalent of “Gross Salary vs. Take-Home Pay.” A high figure on a contract looks impressive, but once you strip away the accounting maneuvers and one-off “bonuses” used to inflate the optics, the actual “spendable” cash generated by the properties can be significantly smaller. To protect your capital, you must look past the “financial engineering” toolkit and identify the red flags that mask a REIT’s core rental health.
1. The “Credit Card” Trick: Borrowing to Pay Dividends
When a property portfolio underperforms, management teams face a terrifying reality: the market is brutal toward DPU cuts. According to Loh, a mere 2% drop in DPU can trigger a sharp 10% sell-off in the stock price. To avoid this bloodbath, managers often reach for a “financial painkiller”—the Revolving Credit Facility (RCF).
Essentially the REIT’s corporate credit card, the RCF allows a manager to draw down debt to “top up” the distribution pot when rent collection is slow or a major tenant leaves. It is a zero-sum game where the REIT might pay 5% or 6% interest to the bank just to give unitholders a 6% yield. This artificially inflated payout wasn’t earned from tenants; it was borrowed, eroding the Net Asset Value (NAV) and reducing the debt ceiling over time.
“The manager uses the credit line as a financial painkiller to mask the symptoms of a weak portfolio, hoping that ‘tomorrow’ will be better so they can pay the bank back. But as we know, if you keep using one credit card to pay another, eventually the interest catches up with you.”
To spot this, savvy investors must look at the Statement of Cash Flows. If “Net Cash from Operating Activities” is consistently lower than the “Total Distributions Paid,” the REIT is effectively borrowing from Peter to pay Paul.
2. The 100% Payout Trap: Why “Generosity” is a Risk
While a 100% payout ratio is often marketed as a sign of management generosity, it is frequently a red flag for a “manager living paycheck-to-paycheck.” In personal finance terms, this is the equivalent of an individual spending every cent of their salary the moment it hits the bank.
By distributing 100% of operational cash flow, the REIT leaves itself with zero emergency funds. If a major roof repair is needed or a tenant suddenly exits, there is no “rainy day fund” to absorb the shock. This lack of a buffer forces the REIT into a corner: they must either take on high-interest debt in a “higher-for-longer” environment or ask unitholders for more cash through a rights issue. True strength lies in a sustainable margin for error, not in exhausting every dollar of liquidity.
3. The “Unit Snowball”: The Hidden Cost of “Buy Now, Pay Later”
One of the most common ways managers “save” cash to prop up today’s DPU is by electing to receive their management fees in units rather than cash. This is a classic “Buy Now, Pay Later” scheme for DPU optics.
While this keeps cash in the pot for unitholders today, it creates a “Unit Snowball.” By constantly issuing new units, the manager is diluting the existing unitholders. More units mean the following year’s earnings must be split among a larger crowd. Unless the underlying properties “perform like a rockstar” and grow significantly, the DPU trajectory will eventually face downward pressure as the “earning pie” is sliced into increasingly smaller pieces. This short-term gain for long-term pain is a hallmark of financial engineering.
4. The Masking Tape: Rental Support and One-off Gains
Beyond borrowing and dilution, managers have three specific “accounting magic” tricks to hide weak organic rental growth.
First, Rental Support or Guarantees from sponsors act as artificial top-ups that inflate income when a building is empty or underperforming. Second, One-off Divestment Gains are often used to pad the DPU, returning your own capital to you under the guise of a dividend. Finally, the Amortization of Lease Incentives can hide the fact that a tenant actually received months of free rent, making the “statutory” income look much healthier than the actual cash hitting the bank account.
5. Measuring “Sweat Equity”: The Management Efficiency Index (MEI)
Traditional metrics like Gearing or the Interest Coverage Ratio tell you about a REIT’s financial health (what it owes), but they fail to measure manager skill. To evaluate the “Alpha” a manager brings to the table, investors should look toward the Management Efficiency Index (MEI), a framework created by the REITsavvy team.
The MEI measures the “sweat equity” of a manager—the extra value they extract from assets per dollar of fee they collect. While the market obsesses over headline yield, the MEI focuses on “Real FFO” (Funds From Operations). Think of FFO as the “True North” of performance; it is a metric that ignores accounting smoke and mirrors and focuses purely on the cash generated by the properties themselves.
The “Organic” Diet: Value Creators vs. The Entitled
In a high-interest-rate environment, the “lazy” managers are exposed. An “Entitled” manager continues to collect base fees while the share price tanks, claiming the decline is “not their fault.”
In contrast, a “Value Creator” acts like an owner. They take the pain alongside unitholders by hedging aggressively, cutting utility costs, and even pivoting to taking fees in cash to prevent unit dilution. Institutional players are increasingly moving away from the “fast food” of headline DPU and switching to an “organic diet” of real cash flow. They aren’t just asking “What is the yield?” but rather “How hard did the manager have to work to get this yield?”
The AGM Power Move: One Question Every Investor Must Ask
As the Annual General Meeting (AGM) season approaches, retail investors have a rare opportunity to strip away the optics. If you want to see behind the curtain of financial engineering, you must use this specific power move:
“Excluding one-off capital distributions and management fees paid in units, what is your ‘Organic Cash DPU,’ is it sufficient to cover the current payout, and what is the Year-on-Year trend?”
This question forces the board to move past statutory reporting and reveal the true earnings power of the underlying property portfolio.
Conclusion: A Shift in Perspective
The era of “cheap money” that allowed financial engineering to flourish is fading. Success in the modern REIT market requires moving away from an addiction to headline DPU and focusing instead on transparency and disciplined landlording.
In business, what gets measured gets done. It is time to stop looking at the decimal point on a dividend and start measuring the real value creation. Before you commit to your next REIT investment, ask yourself: How hard is your REIT manager actually working for your dividend, and is it time to demand an “organic” yield?
Kenny Loh is a distinguished Wealth Advisory Director (RNF# LKK300389588 Representing Financial Alliance) with a specialization in holistic investment planning and estate management. He excels in assisting clients to grow their investment capital and establish passive income streams for retirement. Kenny also facilitates tax-efficient portfolio transfers to beneficiaries, ensuring tax-efficient capital appreciation through risk mitigation approaches and optimized wealth transfer through strategic asset structuring.
In addition to his advisory role, Kenny is an esteemed SGX Academy trainer specializing in S-REIT investing and regularly shares his insights on MoneyFM 89.3. He holds the titles of Certified Estate & Legacy Planning Consultant and CERTIFIED FINANCIAL PLANNER (CFP).
With over a decade of experience in holistic estate planning, Kenny employs a unique “3-in-1 Will, LPA, and Standby Trust” solution to address clients’ social considerations, legal obligations, emotional needs, and family harmony. He holds double master’s degrees in Business Administration and Electrical Engineering, and is an Associate Estate Planning Practitioner (AEPP), a designation jointly awarded by The Society of Will Writers & Estate Planning Practitioners (SWWEPP) of the United Kingdom and Estate Planning Practitioner Limited (EPPL), the accreditation body for Asia.
Arrange for a non-obligatory one-to-one free consultation here!
You can join his Telegram channel #REITirement – SREIT Singapore REIT Market Update and Retirement related news. https://t.me/REITirement
If you need any financial advice, please contact kennyloh@fapl.sg