Money and Me: Is Headline DPU Hiding the Truth About Your REIT?
Listen to the recording below
https://audio.sph.com.sg/podcast-ep/01kkjny2k6pn7jt84kyqbxzsf5/
1. Many investors focus solely on the headline DPU, but you’ve highlighted a “Transparency Gap” in statutory statements. What are some of the specific items that can mask a REIT’s core rental cashflow?
The “Transparency Gap” & Masking Core Cashflow
The headline DPU is a bit like a ‘Gross Salary’ vs. ‘Take-Home Pay.’ The big number on the contract looks amazing, but after you strip away the one-off bonuses and accounting tricks, the actual ‘spendable’ cash can be a lot smaller. We’re warning investors not to fall in love with the big number before checking what’s actually left in the bank.
Many investors treat Distributable Income as synonymous with “profit,” but it’s actually a highly adjusted figure. Specific items that mask core rental health include:
- Rental Support/Guarantees: These are top-ups from sponsors that artificially inflate income when a building is empty or underperforming.
- One-off Divestment Gains: Using “capital gains” to pad the DPU when organic rental growth is flat.
- Amortization of Lease Incentives: This is the Accounting ‘magic’ that hides the fact that a tenant got six months of free rent.
2. When we look at DPU “manipulation” or optics, how do management teams typically bridge the gap between actual operational earnings and the distributions paid out to unitholders?
Bridging the Gap: Optics vs. Earnings
Management teams aren’t necessarily ‘faking’ it, but they are using some very creative financial engineering to bridge the gap.” Management teams have a “toolkit” to maintain DPU optics even when the properties aren’t delivering.
The most common methods are:
- Management Fees in Units: Instead of paying the manager in cash, the REIT issues new units. This “saves” cash to pay unitholders but leads to long-term dilution.
- Capital Distributions: Returning a portion of the original investment (capital) back to unitholders, which is essentially giving you back your own money to keep the yield looking high. It’s like taking $10 out of your left pocket to put $10 in your right and saying you’ve made a profit.
- Swiping the Revolving Credit Line (Credit Card Trick): “When rent collection is slow or a major tenant leaves, a manager might tap into their Revolving Credit Facility (RCF)—essentially the REIT’s corporate credit card. They draw down debt to top up the distribution pot so that unitholders don’t see a dip in their quarterly check. On the surface, the DPU looks stable and ‘safe,’ but in reality, that payout wasn’t earned from tenants; it was borrowed from a bank.” This is something like, you paid 5% or 6% interest to the bank so the REIT can give you a 6% yield. It’s a zero-sum game that actually erodes the Net Asset Value (NAV) and reduced the debt ceiling over time.
The ‘Why’ (The Painkiller): “Why do they do it? Because the market is brutal toward DPU cuts. A 2% drop in DPU can trigger a 10% sell-off in the stock price. The manager uses the credit line as a financial painkiller to mask the symptoms of a weak portfolio, hoping that ‘tomorrow’ will be better so they can pay the bank back. But as we know, if you keep using one credit card to pay another, eventually the interest catches up with you.”
How can an investor spot this?”
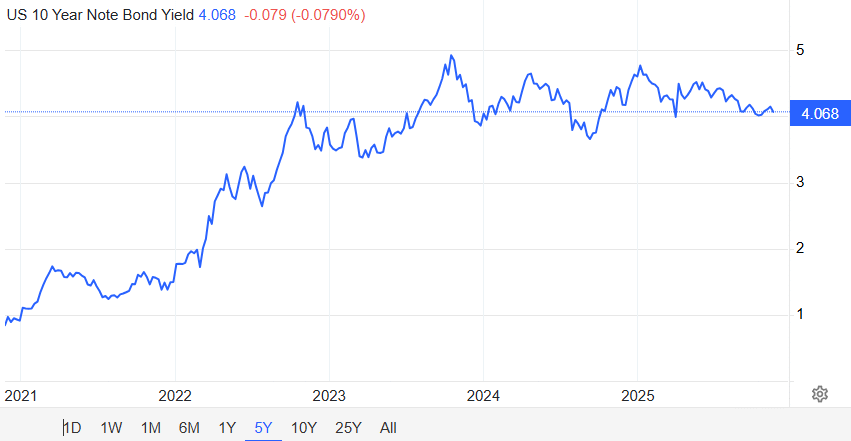
Go to the Statement of Cash Flows. If the ‘Net Cash from Operating Activities’ is consistently lower than the ‘Total Distributions Paid,’ you know they are borrowing from Peter to pay Paul. It’s a huge red flag for the sustainability of that yield.
3. You’ve raised concerns about the “100% Payout Risk.” Why might distributing every cent of operational cashflow be a red flag rather than a sign of strength?
The “100% Payout Risk”
While a 100% payout ratio looks generous, it can be a red flag. It means the REIT has zero margin for error.
- Michelle, let’s look at this through the lens of a personal finance. Distributing 100% of cashflow is like a person spending every single cent of their paycheck the moment it hits their bank account. They have zero emergency funds. Now, ask yourself: What happens to that person if they suddenly lose their job, or if a family member has an unexpected medical emergency? They have no buffer. They’re forced to take on high-interest debt or sell their belongings just to survive.
- It’s the same with a REIT. If they pay out 100%, they have no ‘rainy day fund’ for a major roof repair or a sudden tenant exit. They’re forced to either borrow more at today’s high rates or ask unitholders for more cash through a rights issue. To me, that’s not a sign of a ‘generous’ manager; it’s a sign of a manager living paycheck-to-paycheck.
4. How should investors interpret the use of management fees paid in units rather than cash, and how does this impact the long-term DPU trajectory?
Management Fees in Units: The Long-term Impact
Think of this as a ‘Buy Now, Pay Later’ scheme for DPU.”
- The Impact: Short term it props up the yield today, but it creates a ‘Unit Snowball” in the long term as it increases the total unit base. More units mean the next year’s earnings have to be split among more people. Unless the property performs like a rockstar, the DPU will eventually face downward pressure because the “pie” is being sliced into more and more pieces every year.
5. Regarding newly listed entities like UI Boustead REIT, what specific efficiency signals should investors look for in the early stages of a REIT’s life cycle?
Early Efficiency Signals: UI Boustead REIT & New Listings
For a new listing, don’t just fall in love with the ‘IPO Yield.
Efficiency Signals:
- Look for a high NPI Margin (Net Property Income). If the manager can’t run a brand-new portfolio efficiently now, they certainly won’t when the buildings start to age
- Portfolio Occupancy vs. Market Average: Is the initial high yield propped up by a single “trophy” tenant, or is there a diversified, high-quality base?
- Lease Decay: How the REITs address the lease decay, which impact NAV due to short land lease tenure for Industrial property in Singapore.
- Expense Ratio: Are administrative costs bloated relative to the size of the portfolio? The large scale of economy should bring the unit admin cost down but not the other way.
6. How does the Management Efficiency Index (MEI) differ from traditional metrics like Gearing or Interest Coverage Ratio when assessing a manager’s performance?
Management Efficiency Index (MEI) vs. Traditional Metrics
Traditional metrics like Gearing or Interest Coverage Ratio tell you about financial health, but the MEI tells you about manager skill and performance.
- MEI was created by my REITsavvy team to measure the “Alpha” or extra value a manager extracts from the assets per dollar of fee they take.
- In the US, investors don’t just look at dividends; they obsess over FFO (Funds From Operations). Think of FFO as the ‘True North’ of a REIT’s performance. It’s a metric that ignores the accounting ‘smoke and mirrors’ and focuses purely on the cash generated by the properties themselves.
- The Management Efficiency Index (MEI) brings that same discipline here. We believe a manager’s primary job is to be a great landlord, not a financial engineer. While traditional metrics like Gearing tell you how much the REIT owes, the MEI tells you how well the manager is working the assets. It filters out the ‘cheap debt’ or ‘top-up’ tricks and asks: ‘If we strip away the fancy financing, how much real value is this manager actually squeezing out of these buildings?’ It’s about measuring the ‘sweat equity’ of the manager, not just their ability to sign a loan document.”
7. In an environment of higher-for-longer interest rates, how can an investor distinguish between a manager who is “entitled” to fees and one who is actively creating value?
Distinguishing “Value-Add” from “Entitlement”
When interest rates stay high, the ‘lazy’ managers get exposed. The ‘entitled’ ones keep collecting their base fees while the share price tanking is ‘not their fault’.
- The Value Creator: They take the pain with you. They hedge aggressively, they find ways to cut utility costs, and they might even pivot to cash fees to stop the unit dilution. They act like owners, not just employees.
8. For those heading into AGM season, what is the one question every retail investor should ask the board regarding the sustainability of their distributions?
The One Question for AGM Season
If you only ask one thing, make it this:
“Excluding one-off capital distributions and management fees paid in units, what is your ‘Organic Cash DPU’ and is it sufficient to cover the current payout, and show the trend Year on Year”.
This forces the board to strip away the “optics” and reveal the true earnings power of the properties. I urge all investors to ask this question in the AGM. Invite them to listen to this podcast Money&Me with Michelle Martin for a more direct and transparent reply.
9. Looking ahead, do you expect more S-REITs to shift their reporting focus toward these efficiency metrics, or will the market remain anchored to the headline DPU?
Future Outlook: Efficiency vs. Headline DPU
The current market is still addicted to the ‘headline DPU’—it’s the ‘fast food’ of metrics. It’s quick, it’s easy to digest, but it doesn’t tell you anything about the long-term health of the REIT.
As we move past the era of ‘cheap money,’ the big institutional players are already switching to an ‘organic’ diet. They aren’t just asking ‘What is the yield?’ They’re asking: ‘How hard did the manager have to work to get this yield?’
As an educator in this space, my mission is to move the needle on transparency. I want to see REIT managers move away from financial engineering and get back to their core role as disciplined landlords. We need to start measuring things like the Management Efficiency Index (MEI) or Real FFO because, in business, what gets measured gets done. If we focus on real cash flow and property value creation rather than just the decimal point on a dividend, we’ll build a much more resilient REIT market for everyone
Kenny Loh is a distinguished Wealth Advisory Director (RNF# LKK300389588 Representing Financial Alliance) with a specialization in holistic investment planning and estate management. He excels in assisting clients to grow their investment capital and establish passive income streams for retirement. Kenny also facilitates tax-efficient portfolio transfers to beneficiaries, ensuring tax-efficient capital appreciation through risk mitigation approaches and optimized wealth transfer through strategic asset structuring.
In addition to his advisory role, Kenny is an esteemed SGX Academy trainer specializing in S-REIT investing and regularly shares his insights on MoneyFM 89.3. He holds the titles of Certified Estate & Legacy Planning Consultant and CERTIFIED FINANCIAL PLANNER (CFP).
With over a decade of experience in holistic estate planning, Kenny employs a unique “3-in-1 Will, LPA, and Standby Trust” solution to address clients’ social considerations, legal obligations, emotional needs, and family harmony. He holds double master’s degrees in Business Administration and Electrical Engineering, and is an Associate Estate Planning Practitioner (AEPP), a designation jointly awarded by The Society of Will Writers & Estate Planning Practitioners (SWWEPP) of the United Kingdom and Estate Planning Practitioner Limited (EPPL), the accreditation body for Asia.
Arrange for a non-obligatory one-to-one free consultation here!
Click Here to Book a Private Consultation
You can join his Telegram channel #REITirement – SREIT Singapore REIT Market Update and Retirement related news. https://t.me/REITirement
If you need any financial advice, please contact kennyloh@fapl.sg
2025
- Money and Me: Are S-REITs Still Worth the Climb? (October 2025)
- Money and Me: S-REITs vs Banks – Is It Time to Rotate? (August 2025)
- Money and Me: Are S-REITs Still Worth the Risk in 2025? (July 2025)
- Money and Me: REITs Among Upcoming IPO’s and what you need to know (June 2025)
- Money and Me: S-REITs Bounce Back? China’s REIT Game-Changer and the hunt for yield of up to 8% (May 2025)
- Money and Me: How are S-REIT’s doing amidst the Tariffs Turnaround? (April 2025)
- 𝗠𝗼𝗻𝗲𝘆 𝗮𝗻𝗱 𝗠𝗲: 𝗦-𝗥𝗘𝗜𝗧𝘀 𝗥𝗮𝗹𝗹𝘆, 𝗧𝗿𝗲𝗮𝘀𝘂𝗿𝘆 𝗬𝗶𝗲𝗹𝗱𝘀 𝗗𝗿𝗼𝗽, 𝗮𝗻𝗱 𝗖𝗗𝗟’𝘀 𝗙𝗮𝗺𝗶𝗹𝘆 𝗗𝗿𝗮𝗺𝗮 (March 2025)
- Money and Me: CPF Special Account Closure, Retirement Planning, and Investment Strategies with Kenny Loh (February 2025)
- Money and Me: What is your T-Bill to S-REIT allocation? (January 2025)
2024
- Money and Me: Trump’s Second Term, Bitcoin, Tesla, AI, and Suntec REIT Mandatory Cash Offer (December 2024)
- Money and Me: Data Centered S-REITs; here is what you need to know (November 2024)
- Money and Me: Finding attractive S-REITs in a rate cutting environment (October 2024)
- Money and Me: What’s behind the S-REIT Rally? Fed Rate Cuts, and should Finfluencers be managed? (September 2024)
- Money and Me: Navigating S-REITs Amid Earnings Season and Potential US Rate Cuts (August 2024)
- Money and Me: Navigating Challenges for Mapletree REITs and REITs related to Changi Business Park
(June 2024) - Money and Me: Winners and Losers Among S-REITs, Frasers Property’s Profit Plunge, and the Impact of Sustained High Interest Rates (May 2024)
- Money and Me: Manulife US REIT where could it be heading? Are we at the tail end of the down cycle for S-Reits? (April 2024)
- Money and Me: Will more S-REIT’s suspend distributions? (March 2024)
- Money and Me: US Office Reits – the immediate outlook is bleak but there are opportunities for investors (February 2024)
- Money and Me: Why S-REIT investors are focused on valuations in 2024? (January 2024)
2023
- Money and Me: Can Manulife US REIT be saved? (December 2023)
- Money and Me: Finding bargains in the S-REITs sector today (November 2023)
- Money and Me: How a contrarian investor reads a sell-off (October 2023)
- Money and Me: Finding bargains in the S-REITs sector today (September 2023)
- Money and Me: S-REITs earning stars and landscape quakes (August 2023)
- Money and Me: 3 Singapore REITs to watch (July 2023)
- Money and Me: Are S-REITs in for a promising 2H2023? (June 2023)
- Money and Me: How might the expectations of an impending recession affect S-REITs? (May 2023)
- Money and Me: S-REITs’ 2023 1st quarter report card review (April 2023)
- Money and Me: S-REITs that will hold up well in an increasing interest rate environment (March 2023)
- Money and Me: Winners and losers of latest S-REITs earnings season (February 2023)
- Money and Me: S-REITs’ 2023 outlook (January 2023)
2022
- Money & Me: Is 2023 the year of recovery for S-REITs? (December 2022)
- Money & Me: What happens after the recent S-REIT crash? (November 2022)
- Money & Me: Further Interest Rate Hikes, FHT’s failed Privatization bid (September 2022)
- Money & Me: Q3 2022 SREIT winners (August 2022)
- Money and Me: REIT picking in an inflationary environment (July 2022)
- Money and Me: Are Hospitality REITs the clear way to play the reopening trade in Singapore? (June 2022)
- Money and Me: Can S-REITs maintain its upswing from Q1? (May 2022)
- Money & Me: The case for being bullish on S-REITs amid the Ukraine crisis (March 2022)
- Money & Me: Optimism for S-REIT’s given earnings signals and mapping the possibilities for shareholders in the Mapletree merger (February 2022)
- Money & Me: Mapletree merger, growth in commercial S-Reits and the potential return of Reit IPOs in 2022 (January 2022)
2021
- Money & Me: First Reit, CapitaLand, Daiwa, Digital Core Reit and the best of the S-Reit pivots (December 2021)
- Money and Me: VTL’s and hospitality and retail, a new Reit ETF and Making sense of offers for SPH (November 2021)
- Money and Me: Who benefits from the ESR – ARA Logos Logistics Trust merger? (October 2021)
- Money and Me: China’s Evergrande Group property and the spillover in the property market, breaking down what CapitaLand Invest means for the investor and global REITs to watch (September 2021)
- Money and Me: Are retail and hospitality aggressive plays given the pace of reopening? (August 2021)
- Money and Me: Which REITs have seen a limited impact on occupancy during COVID? (July 2021)
- Money and Me: An overview of the REIT performance (June 2021)
- Money and Me: S-REIT’s: which are most likely and which least likely to be affected by new social restrictions? (May 2021)
- Money and Me: What’s the link between bond yields and S-REITs? (April 2021)
2020
- Money and Me: REITS that did well in 2020 (December 2020)
- Money and Me: An overview of S-REITS, value rotations and REITS paying out higher dividends (November 2020)
- Money and Me: Yield Generating Asset Classes (October 2020)
- Money and Me: The REIT outlook within and beyond Singapore (August 2020)
- Money and Me: Ugly Duckling Earnings turning into Beautiful S- Reit swans? (July 2020)
- Money and Me: V for S-REITs? (June 2020)
- Money and Me: Will revenge spending help REITs? (May 2020)
- Money and Me: What REITs to Look out for? (April 2020)
- Money and Me: Crazy REIT Sales (March 2020)