Overview of Technology Sector (Dec 2018)

  • Post author:

By: Soh YJ


NASDAQ Composite (^IXIC) is a stock market index of all domestic and international based common stock and similar securities (ADRs, tracking stocks, REITs, limited partnership interests) listed on NASDAQ stock market. NASDAQ Composite is heavily weighted toward technology companies.


The top 10 companies, in term of market capital, in the NASDAQ are listed below table. As we can see most of the big players are mostly technology companies.


The NASDAQ Composite Index Trend

The chart represent the NASDAQ Composite Index. From the chart, we can notice 3 things:

  • The trend is always up through disaster after disaster
  • The market don’t go straight up, it fluctuate up and down when trending upward.
  • There are big ugly events


Why is market trend up in the long run? This is because market is not stagnant and is self-cleansing, companies routinely fade away and is replace by new blood. In the worst, scenario a stock can loss 100% of its value, disappeared and never be heard again. On the other hand, as new company grow, prosper and go public, they replace the dead and dying companies. When you own a stock, you own a piece of business fill with people working to expand and serve the customer base, competing in an unforgiving environment that reward those who can make it happen and discard those who cannot. Thus create an upward bias trend, however this only applicable for Index Fund.


Why most traders lose money? The market don’t go straight up. The price fluctuate while trending up. Nobody can time the market


DON’T

(1) Buy breakout and sell breakdown. Chasing the stock price around.

(2) Cut losses short and let the winner run.

(3) Size the position too big.

(4) Never cap their profit potential.


DO

(1) Buy into weakness, Sell into strength.

(2) Set a profit target & patient with losing trade

(3) Size the position correctly. So you would make decision based on logic rather than emotion

(4) Reduce cost basis. Making small profit over and over again is more sustainable.


Big ugly events in market, or is it? During certain timeline, certain event occurred and it causes high volatility in the stock market and people get emotional and start selling-off.


Long term Investor– Should not be too worry as you know market always trend upward.


  • You could continue to make your timely investment contribution. As a long term investor, you should have a diversified portfolio. This can be achieved easily by ETFs or unit trust without huge capital. Never invest in a single company as you never know if the company could survived 10 – 30 years down the road.
  • You can contribute more to your investment as the price will be cheaper than before. But do not overdo it as bear market normally last 2 – 3 years. Good to have some spare cash.


Trader– A perfect opportunity to earn some cash as the market may down more than 50%.


  • You could increase your position size (but don’t overdo it) either by shorting the Index fund or purchasing inverse ETF, while waiting for the market to recover.


Current Market Situation (21 Dec 2018)


The US-China Trade war had finally taken its toll on the US market. On September 2018, an evening star pattern mark the reversal of the NSADAQ Composite up trend. On December 2018, a bearish engulfment candlestick appeared.


FED announced raising the interest rate on 20 Dec 2018 and possible of 2[1] more raises in 2019, caused the stock to fall sharply as Nasdaq closes. Currently there is no clear support on the medium term, but looking at the whole timeline the nearest possible support should be around 4732 (down 40%).

Monthly candlestick pattern of NASDAQ Composite (18 Dec 2018)


Possible support for NASDAQ Composite @ long term


Top 3 Technology ETF for Investors

For long term investor, when selecting the ETF there is some considerations:

  • Expense ratio
    • Fees you have to pay annually, the lower the better
  • Market capitalization
    • Avoid closure/delist from the exchange [Big Cap- more $10B, Mid Cap- $10B to $2B, Small Cap- Less than $2B
  • Correlate to the index
    • You want the ETF as close as the index, market always go up in long term.


ETF TICKER Expense ratio[2]

[%]

Market Cap [Billion] [2] Beta[2]
Fidelity MSCI Information Technology Index FTEC 0.08 2.22 1.08
Vanguard Information Technology Index VGT 0.1 21.69 1.08
Technology Select Sector SPDR XLK 0.13 19.12 0.99


Top 3 Technology ETF for Trader

For short to medium traders, different consideration to be considered.

  • Liquidity
    • Trader want to get in and out quick. The liquidity of ETFs is affected by the composition and trading volume of the holding securities.
  • Volatility
    • With higher volatility the % of price changes will be greater, while the trending is still following the index.


ETF TICKER Market Cap [Billion] [2] Beta[2]
SPDR S&P Biotech XBI 4.38 2.12
iShare Nasdaq Biotechnology IBB 8.35 1.63
Invesco Dynamic Biotechnology & Genome


PBE 0.29 1.7


Reference

[1] https://www.cnbc.com/2018/12/19/fed-hikes-rates-by-a-quarter-point-.html

[2] https://sg.finance.yahoo.com/

Continue ReadingOverview of Technology Sector (Dec 2018)

1st Year Yield of Singapore Saving Bond Hit 2%!

  • Post author:

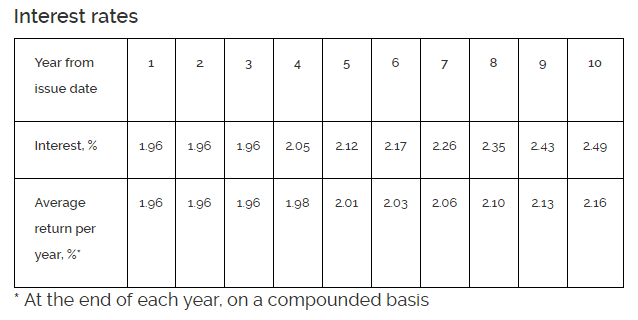
This is the first time 1st year yield of Singapore Saving Bonds (SSB) hit 2%, for GX19010T.


I use Singapore Saving Bonds as the parking facility for my emergency fund. Emergency fund is one of an important aspect in personal financial planning.

Advantage of Singapore Saving Bonds as Emergency Fund Parking Facility

  1. Guaranteed by Singapore government with AAA credit rating
  2. Virtually zero risk and arguably safer than putting your money in saving accounts of any banks.
  3. No price volatility.
  4. 1 month redemption period with no penalty.
  5. No lock in period.
  6. You can keep your money in SSB and interest rate will automatic increase year over year.
  7. Interest payout every 6 months.
  8. Starting amount as low as $500

You can check out this Singapore Saving Bond website for more detail.


Continue Reading1st Year Yield of Singapore Saving Bond Hit 2%!

Singapore REIT Bubble Charts Dec 2018

  • Post author:

Bubble charts derived from Dec 3, 2018 Singapore REITs Fundamental Comparison Table. Two observations compared to last Bubble Charts.

(1) There are a few REITs move further from right to left of the Price/NAV axis due to rights issue (e.g. Keppel KBS REIT and Cromwell REIT) and price sell off (FIRST REIT). The distribution yield is also getting very attractive. This indicates some REITs are getting cheap based on valuation. Note: Distribution yield is lagging.

(2) There are no significant changes in gearing ratio.

These Bubble Charts are used to show the “relative” position compare to other Singapore REITs.

Two visual bubble charts to pick and avoid:

  1. Undervalue Singapore REITs with High Distribution Yield** (Value Pick)
  2. Overvalue Singapore REITs with High Gearing Ratio (Risk Avoidance)

** Distribution Yield are lagging.

Compared to previous Singapore REIT Bubble Charts here.


Disclaimer: The analysis is for Author own use and NOT to be used as Buy / Sell recommendation. Get a proper training on “How to use this Singapore REIT Bubble Charts?” here.


Check below on other events:

https://mystocksinvesting.com/course/singapore-reits-investing/REITs Investing Course 

https://mystocksinvesting.com/course/private-portfolio-review/REITs Portfolio Advisory 

https://mystocksinvesting.com/events/

Continue ReadingSingapore REIT Bubble Charts Dec 2018