Global Stock Market Indices PE Ratio At a Glance (18 October 2015)

  • Post author:

Market Indices PE Ratio for Major Stock Exchange globally

  • US: Dow Jones Industrial, S&P500, NASDAQ, Russell 2000
  • Europe: FTSE100, CAC40, DAX
  • Asia: KLCI, STI, HangSeng, ASX200, CSI 300, JCI, SET, KOSPI, NIKKEI 225, SENSEX, TWSE, NZX50, PSEi

Global Stock Market PE PB Ratio Summary Oct18-2015

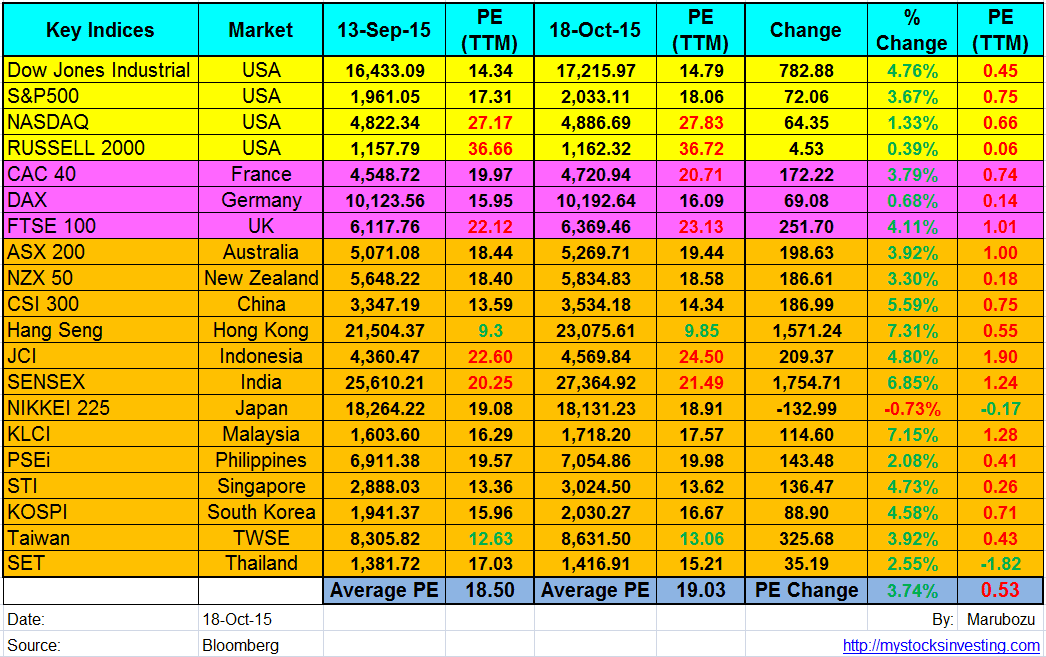
  •  PE  = Price Per Earning

See Sept 2015 Global Stock Market PE Ratio here.

Average PE ratio increased from 18.50  to 19.03 after the recent huge rebound. Malaysia KLCI  and Hong Kong Hang Seng are two of the best performers during this rebound with more than 7% gain. VIX reduced to 15.05 showing that the fear is dissipating in the stock market.

VIX Oct18-2015Shiller PE Ratio Oct18-2015S&P500 PB Ratio Oct18-2015S&P500 Dividend Yield Oct18-2015


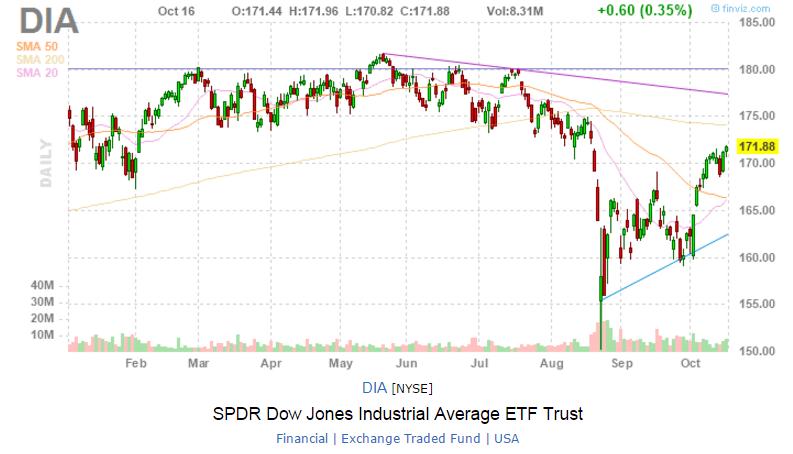
Dow Jones Industrial, S&P500, NASDAQ, Russel 2000 Charts

  • $INDU, $SPX, $COMPQ, $RUT, $TRAN rebounded strongly but currently facing important resistance. All the 5 indices are still trading below the 200D SMA which is trending down. Can this rebound continue or this is just a Dead Cat Bounce?

$INDU Oct18-2015$SPX Oct18-2015$COMPQ Oct18-2015$RUT Oct18-2015$TRAN Oct18-2015

DIA Oct18-2015QQQ Oct18-2015IWM Oct18-2015

Past 1 Month Sector Performance

Sector Performance Oct18-2015


Treasury Yield

US 5 Year Treasuy Yield Oct18-2015US 10 Year Treasuy Yield Oct18-2015US 30 Year Treasuy Yield Oct18-2015 Yield Curve Oct18-2015


Continue ReadingGlobal Stock Market Indices PE Ratio At a Glance (18 October 2015)

Top 5 Highest Dividend Yield for Singapore REIT

  • Post author:

Gold TOP five.

High Distribution Yield always come with risk, find out the analysis on how to identify Risk Factors for Singapore REIT here.


Continue ReadingTop 5 Highest Dividend Yield for Singapore REIT

Singapore REIT Bubble Charts Oct 2015

  • Post author:

Bubble chart derived from Oct 3 Singapore REITs Fundamental Comparison Table.

These Bubble Charts are used to show the “relative” position compare to other Singapore REITs.

Two visual bubble charts to pick and avoid:

  1. Undervalue Singapore REITs with High Distribution Yield (Value Pick)
  2. Overvalue Singapore REITs with High Gearing Ratio (Risk Avoidance)

The Singapore REIT Bubble charts are best used to visually Short List Singapore REIT only.

Singapore REIT Bubble Chart (Value) Oct6-2015Singapore REIT Bubble Chart (Risk) Oct6-2015

Disclaimer:

  1. The bubble charts are NOT to be used as Investing decision.
  2. Besides looking at the Price/NAV, Distribution Yield, Gearing Ratio, Investors still have to conduct Risk Assessments, Qualitative Analysis and Sector / Trend Analysis on the REITs.
  3. The Author does not guarantee the accuracy of the data presented and not responsible for any readers profit & loss should an investment decision being made using the data in this blog. https://mystocksinvesting.com


See last Singapore REIT Bubble Charts here to see the relative movement.

Current distribution yield for Singapore REITs are very attractive but there are downside risks base on fundamental and technical analysis. Investors are strongly encouraged to acquire a proper financial education on how to analyse Singapore REITs to make a safe investing decision, instead of just asking around for the stock tips.

Continue ReadingSingapore REIT Bubble Charts Oct 2015