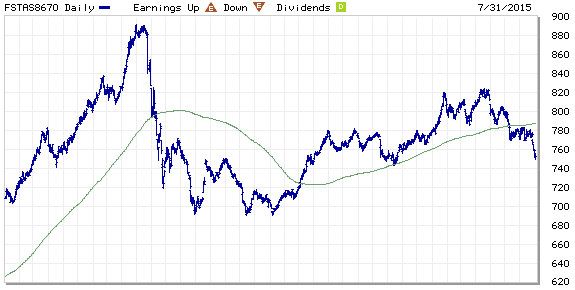
FTSE ST Real Estate Investment Trusts (FTSE ST REIT Index) decreases from 781.09 to 752.6 (-3.65%) compare to last post on Singapore REIT Fundamental Comparison Table on July 1, 2015. The index has broken down from the 200D SMA support and it is a confirmed down trend. Immediate resistance at 770. Expect more down side in coming months.
Learn how to conduct Trend Analysis here.
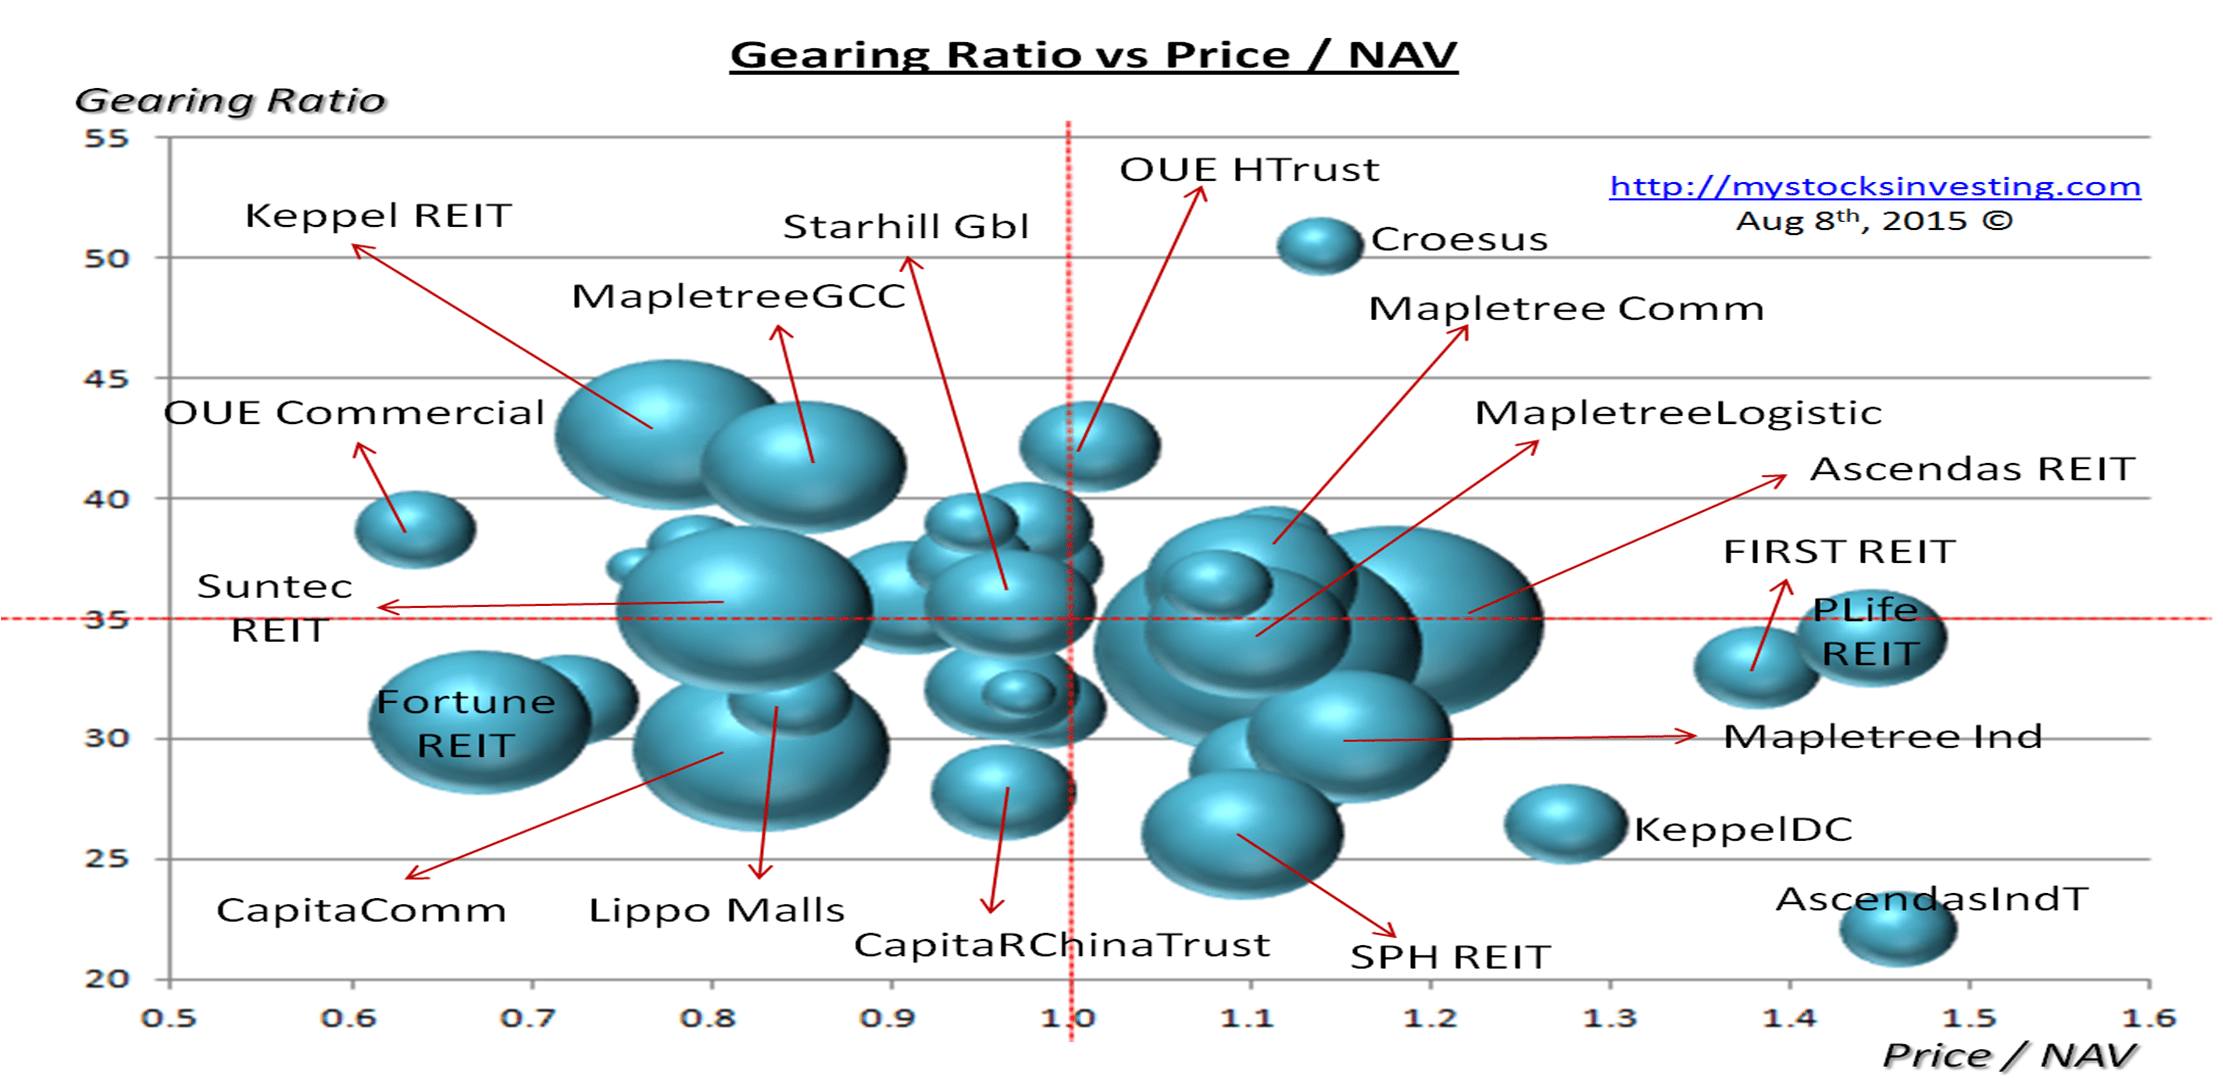
- Price/NAV decreases from 1.03 to 1.00. (Singapore REIT in at fair value now)
- Distribution Yield increases from 6.61% to 6.84% (take note that this is lagging number)
- Gearing Ratio reduces from 34.08% to 34.02%.
- Most overvalue is Ascendas iTrust (Price/NAV = 1.46) followed by Parkway Life (Price/NAV = 1.45).
- Most undervalue is OUE Commercial Trust (Price/NAV = 0.64), followed by Fortune REIT (Price/NAV = 0.67).
- Higher Distribution Yield is VIVA Industrial Trust (9.45%) followed by iREIT Global (9.07%). Note: High Distribution Yield does not mean it is safe REIT for investment. Don’t invest purely base on the Yield % because it is wrong thing to do without knowing the reasons.
- Highest Gearing Ratio is Croesus Retail Trust (50.4%) followed by Keppel REIT (42.6%)
Grab an insight of the REIT class here 3 Tips To Increasing Returns On REITs Investments
Check out the very pragmatic and educational public seminar here “Investing in Singapore REIT“.


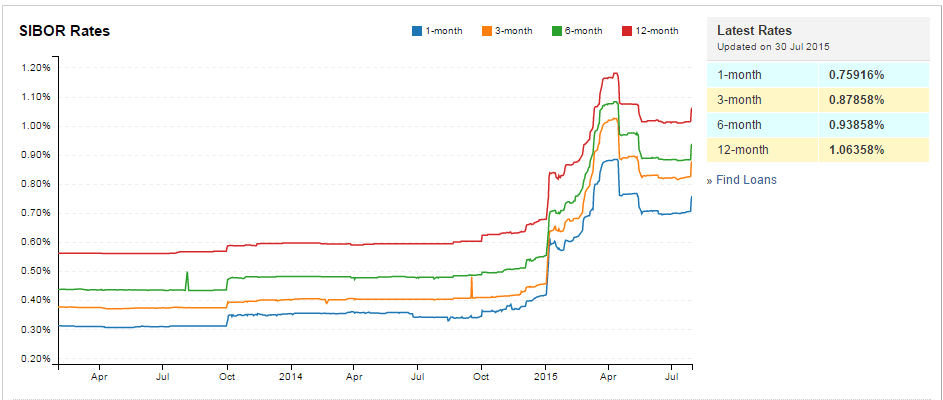
- Singapore Interest Rate increase from 0.39% to 1.01% (a huge spike in one month!).
- 1 month increases from 0.69688% to 0.75916%
- 3 month increases from 0.82100% to 0.87858%
- 6 month increases from 0.88374% to 0.93858%
- 12 month increases from 1.01367% to 1.06358%
A huge spike in Singapore Interest rate and a down trend in FTSE ST Real Estate Investment Trust Index may scare off some investors. Base on the trend analysis from the stock chart, there are weakness in Hospitality and Commercial Trust, but Retail Mall and Healthcare are still holding well. The current correction of Singapore REITs present a good opportunity to pick up some fundamental strong REITs for long term passive income investing. Wait for the moment of “Movement in Sympathy” of REIT sell off when the interest rate hike and prepare for shopping list! The key question is which REIT to put into watchlist and When is the right time to buy.
Check out all Singapore REITs Chart Here.