Gold is Cheap! Is it the right time to buy Gold?

  • Post author:

Gold has dropped a lot and getting near to the 5 years low. Gold is getting very attractive at the current level for many gold lovers, and many investors are tempted to buy gold at this level. However, technically speaking base on the chart, there may be more down side coming after the Gold (GLD) has broken the significant support at $115. GLD is trading in a confirmed down trend.

GLD Nov7-2014 (5 Year)GLD Nov7-2014

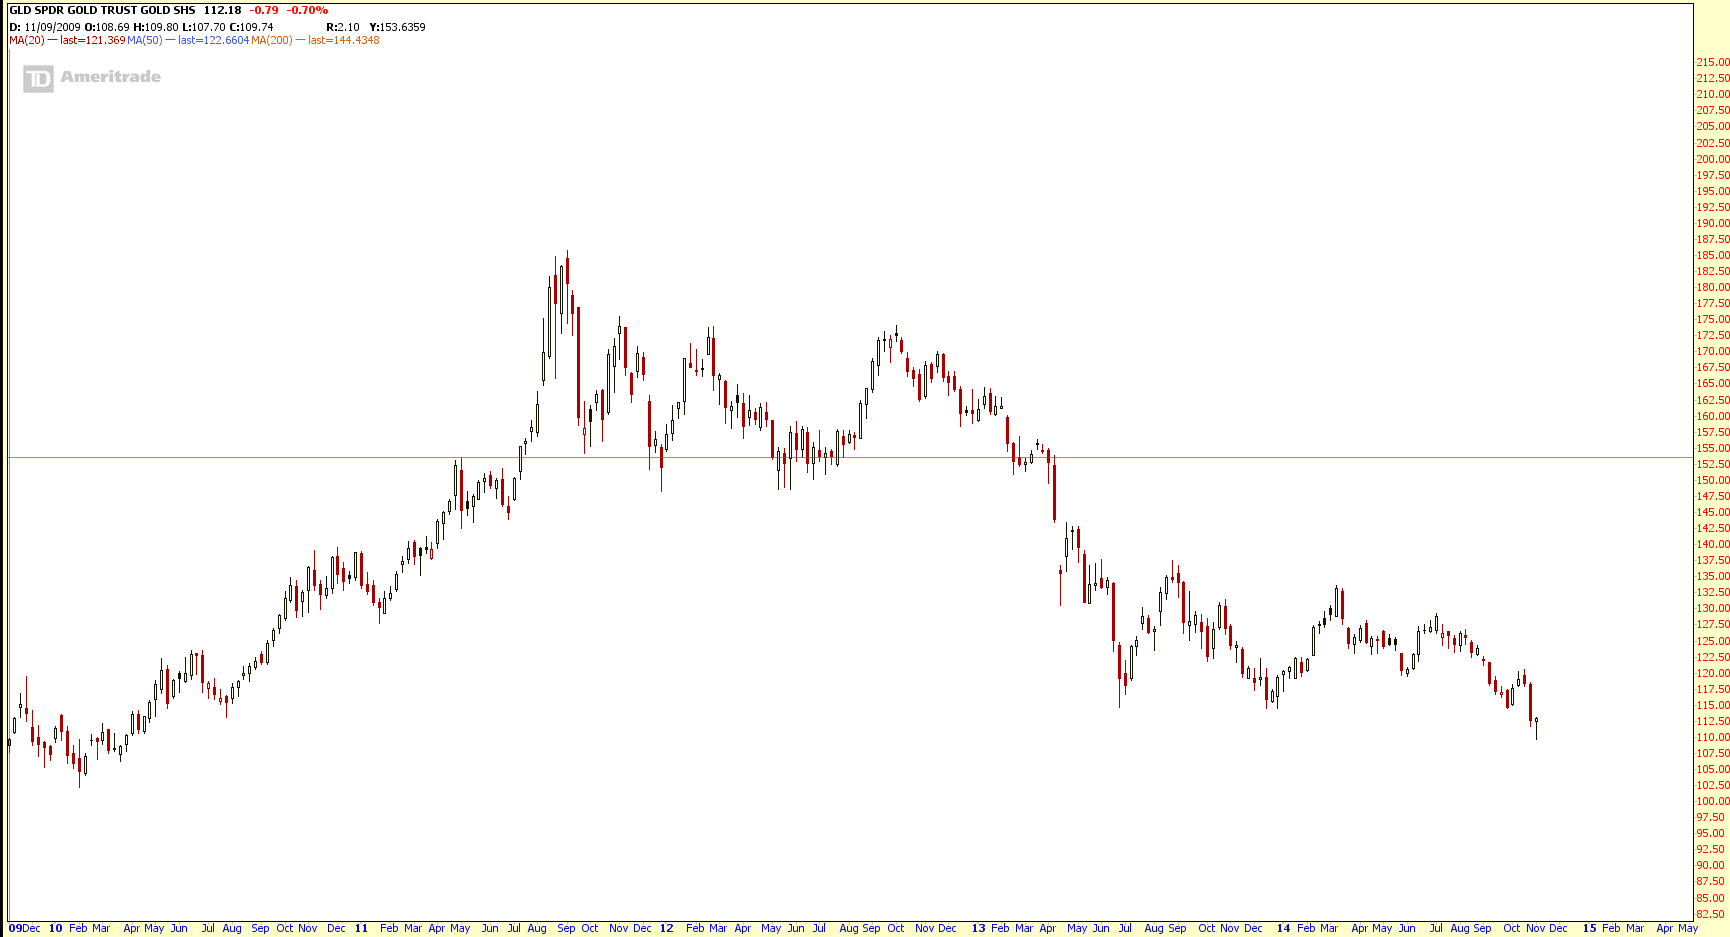
Currently GLD is rebounding from the low of $109 but $115 will serve as a Support Turned Resistance. If GLD is unable to break this resistance, the price target will be $106 base on 161.8% Fibonacci Expansion.

Original Post by Marubozu My Stocks Investing Journey

Continue ReadingGold is Cheap! Is it the right time to buy Gold?

Safe to Long Crude Oil? Check the USO (United States Oil Fund) Chart

  • Post author:

Crude oil has reached 5 years low. Base on USO  (United States Oil Fund) chart, the support is at about $29. There is a trading range of $10 ($29 to $39) base on the chart. Risk vs Rewards looks very attractive to long USO at current level.

USO Nov7-2014

Original Post by Marubozu My Stocks Investing Journey

Continue ReadingSafe to Long Crude Oil? Check the USO (United States Oil Fund) Chart

Boeing (BA): Descending Triangle

  • Post author:

Boeing has been trading within a Descending Triangle consolidation mode for many months. This chart pattern is not for investor (cannot make money from buy low sell high strategy) because the stock price is moving side way.

However this chart pattern is very good for Option traders and range trader (using CFD) for short term trading.

BA Nov6-2014

Option Strategy

  • Short Vertical Call Spread near Resistance – Bearish Direction
  • Short Vertical Put Spread near Support ($119 has been a reliable support, also the 38.2% Fibonacci Retracement Level) – Bullish Direction
  • Short Iron Condor between $117 and $131 – Non Directional & Premium Collection
  • If $119 support is broken, Long Put if Vega is low.

Range Trading using CFD Strategy

  • Short at Resistance (Declining Trend Line) 
  • Long at Support (at about $119)
  • About $10 range

Original Post by Marubozu My Stocks Investing Journey

Continue ReadingBoeing (BA): Descending Triangle