In general, your portfolio should have a lot of red (if you are still holding now) if you have invested in any property stocks (Capitaland, Keppel Land, City Development, UOL, etc) and REITs but did not hedge your portfolio with CFD.
So A-million dollar questions to most of the investors or traders in Singapore including myself:
- Is it the right time to pick up property stocks or REITs since the stock price has dropped so much?
- What should I do if I am still holding those property stocks and REITs? Should I cut loss or hold on and wait for the recovery?
- Is there any trading opportunity in property stocks?
Fundamentally the real estate / property sectors are hit by all the cooling measures and fear of interest hike due to QE tapering. I will not touch on the above 2 topics as there are already a lot of news and articles talking the impact to the property sectors in Singapore. I will be focusing in using technical analysis to analyse the overall trend for property sectors as a whole and individual stocks.
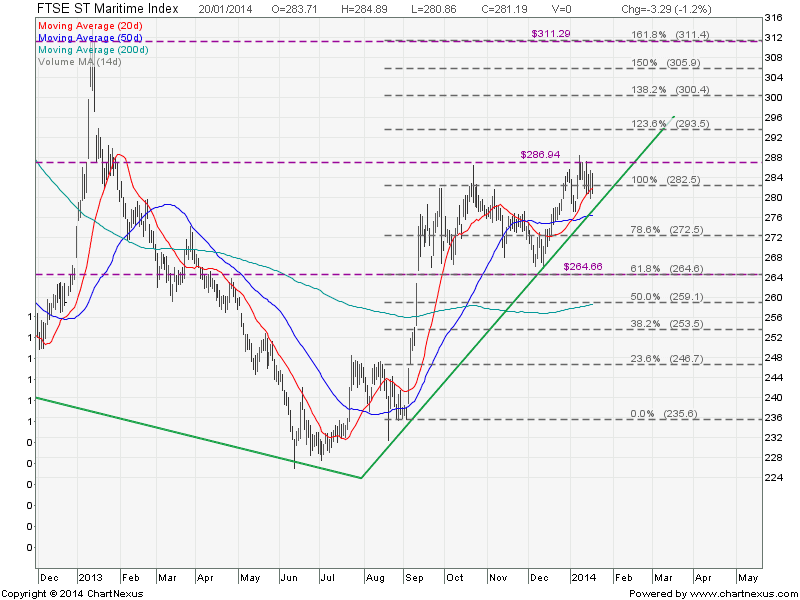
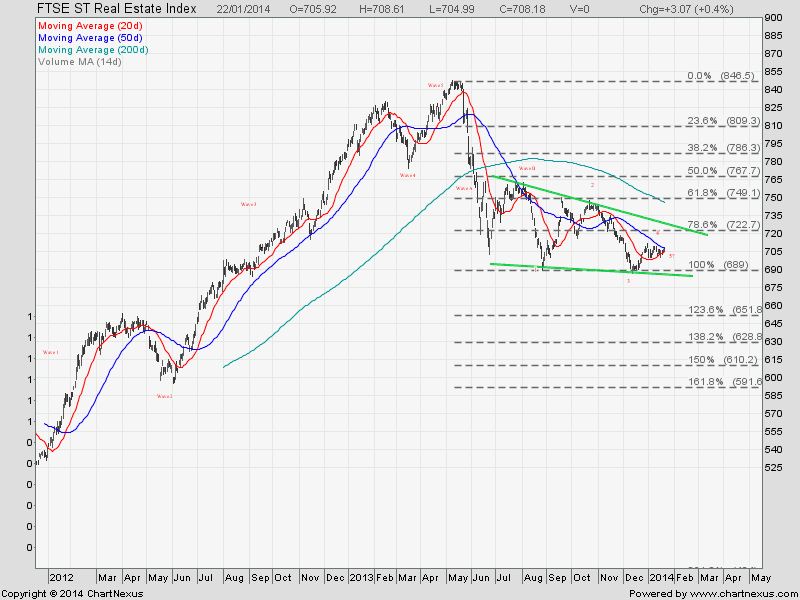
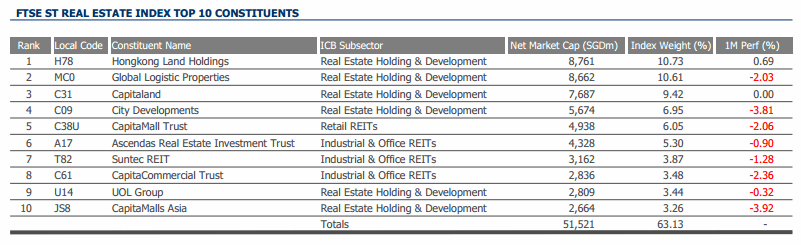
FTSE ST Real Estate Index
The index is trading in a Elliott Wave pattern and there is a possibility to start a Big Wave C down if break down from the Falling Wedge.
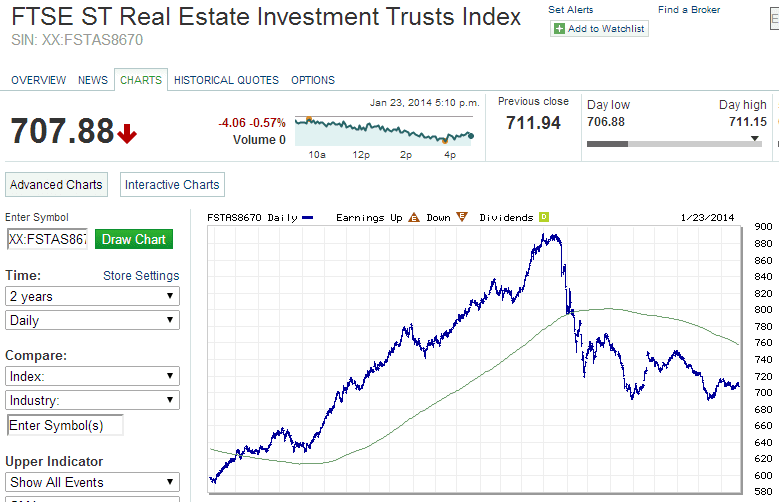
FTSE ST Real Estate Investment Trust Index
Singapore REITs is officially enter into bear trend after dropping more than 20% from the top.
The chart pattern is similar to FTSE ST Real Estate Index (Elliott Wave + Falling Wedge). More selling of the REIT is the support (about 690) of Falling wedge is broken.
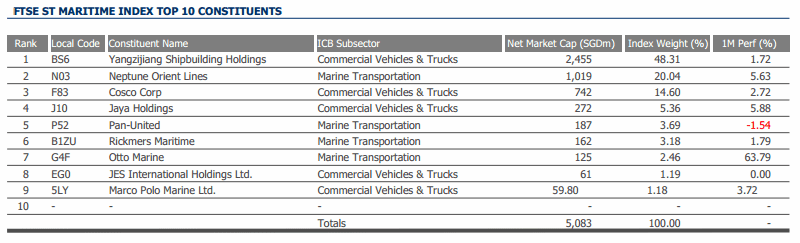
FTSE ST Real Estate Index Components Stocks
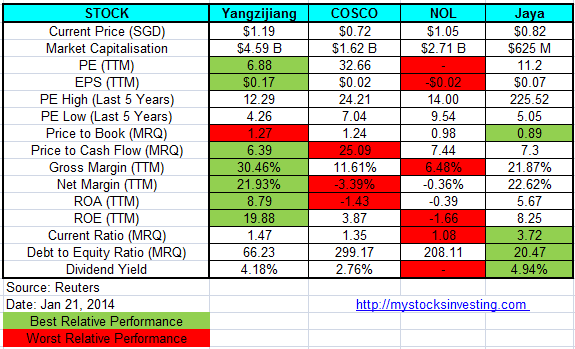
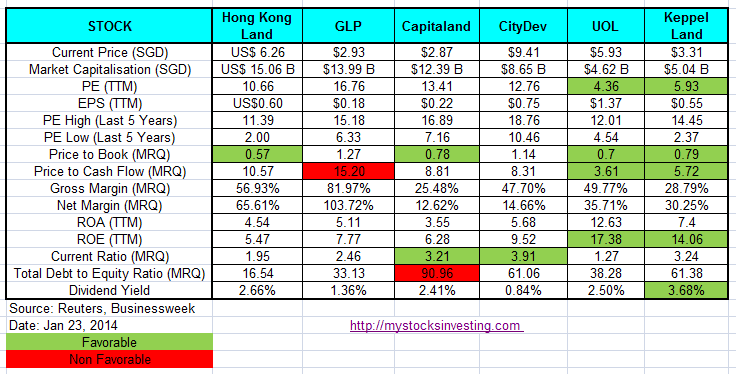
Fundamental Comparison for Key Component Stocks and Property Stocks
Fundamental Comparison for Singapore REITs
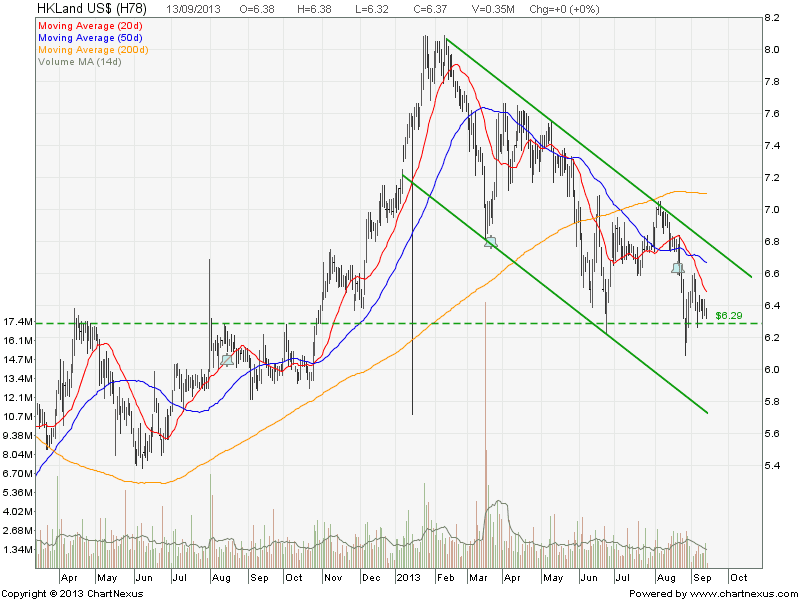
Hong Kong Land – Down Trend
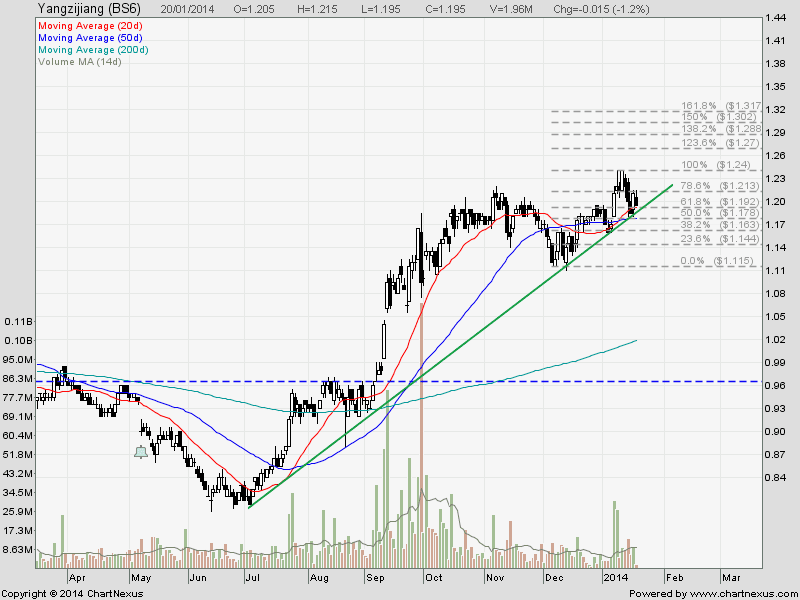
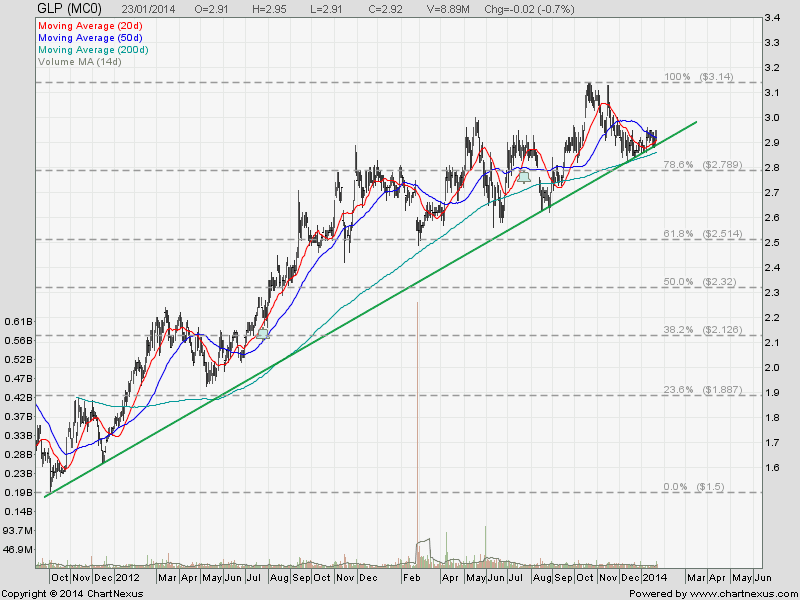
Global Logistic Properties (GLP) – Up Trend
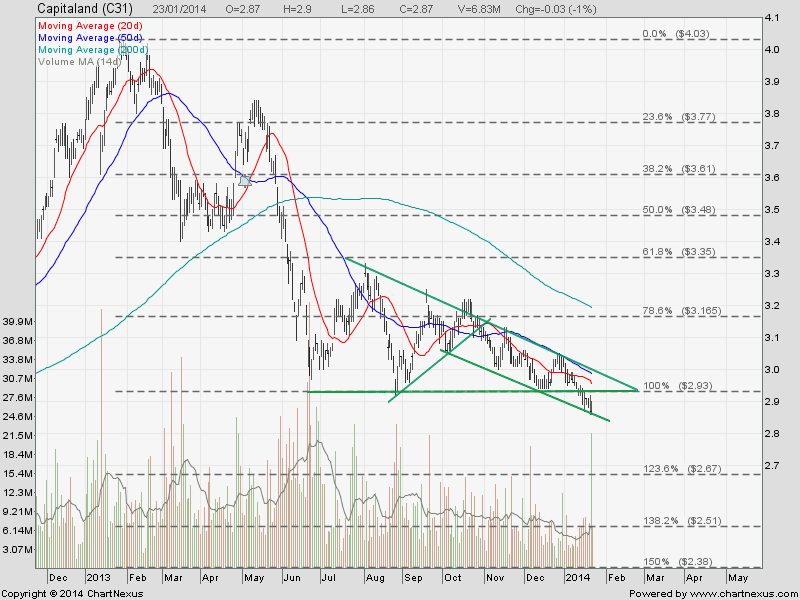
Capitaland – Break out from Descending Triangle. Continue Down Trend.
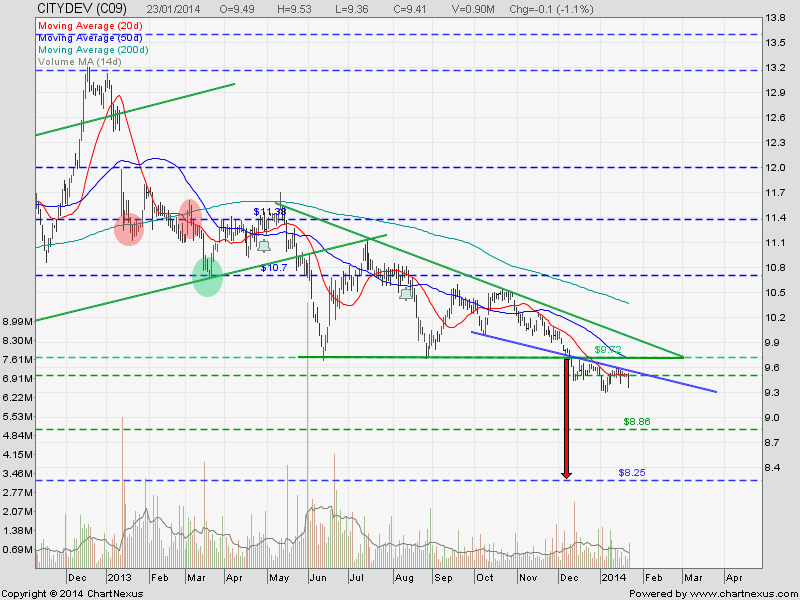
City Development – Break out from Descending Triangle. Continue Down Trend.
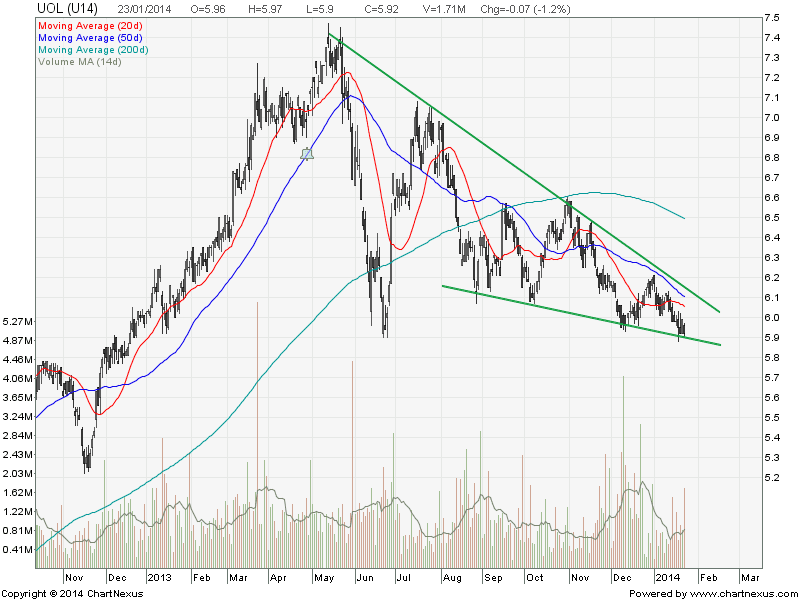
UOL Limited – Trading in a Falling Wedge.
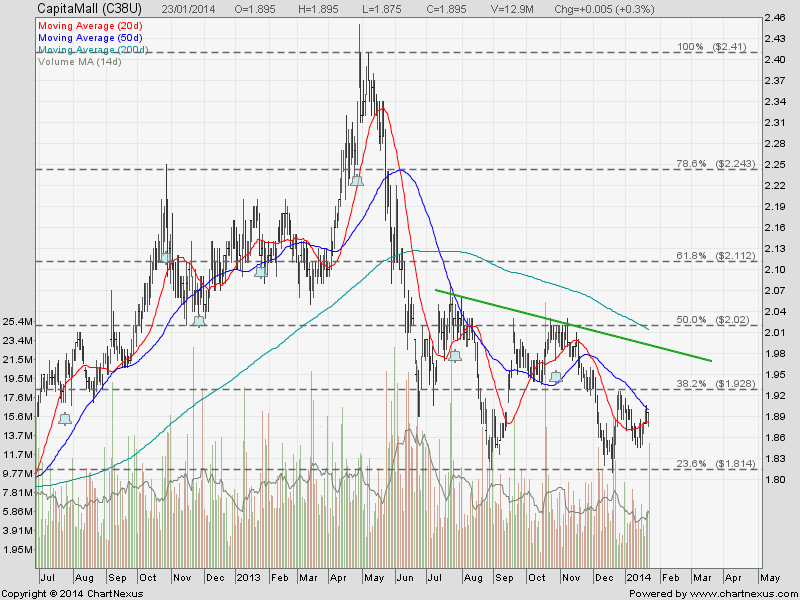
CapitaMall Trust – In consolidation.
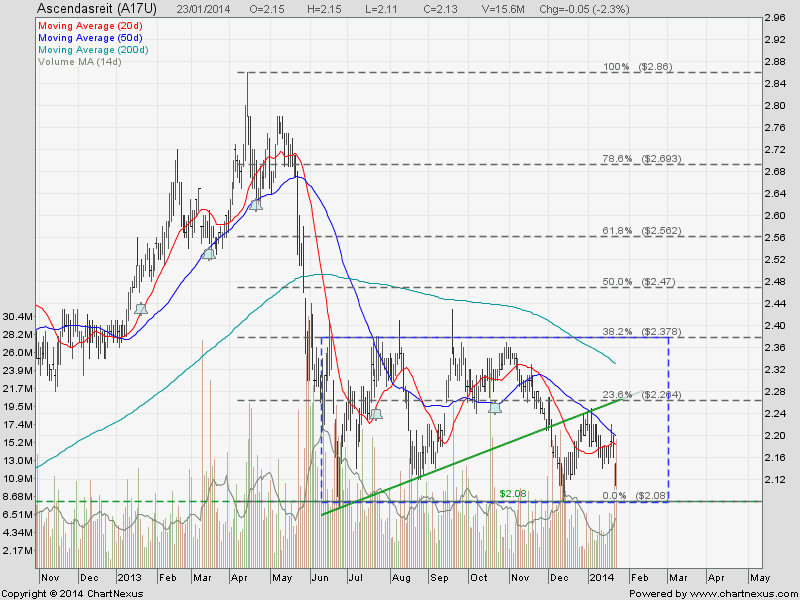
Ascendas REIT – Consolidation in Rectangle. Range Bound.
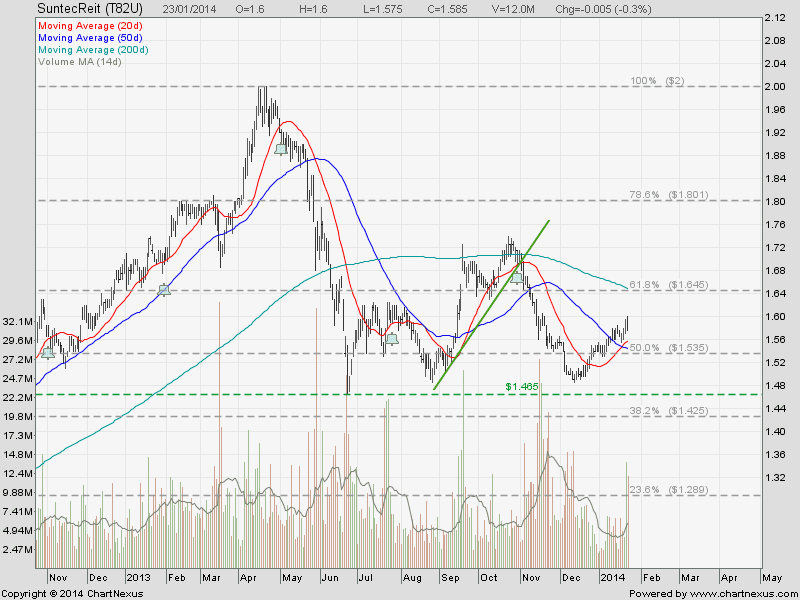
Suntec REIT – In consolidation.
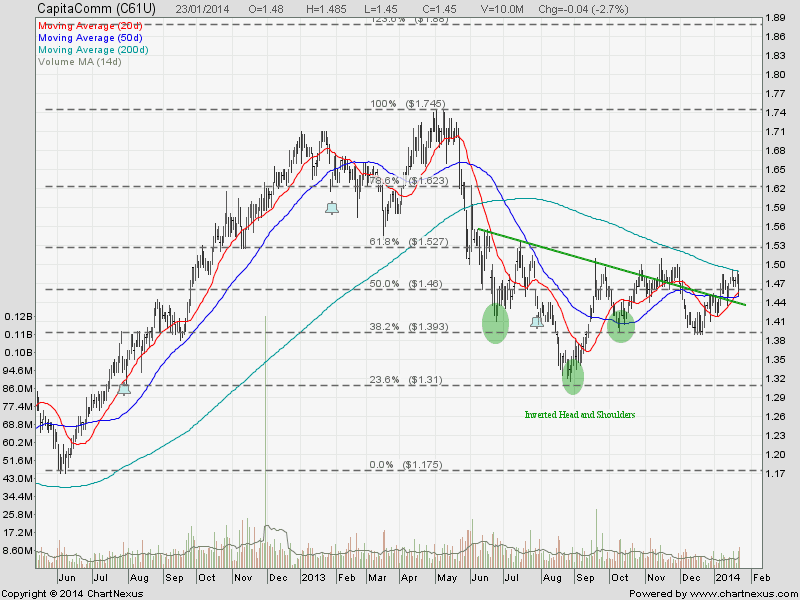
CapitaCommercial Trust – In consolidation.
Summary
Most of the property stocks and REITs either trading on down trend on in consolidation. Take note that the stocks are trading below 200D SMA (long term trend) which is sloping down (bearish signal). Base on the charts, this property and Real Estate sector have not found the bottom yet and probably will continue trading in a down trend in 2014. Bad news for investors who are still holding the stocks but good news for traders who know how to short the stock market. It will be a while for those smart investors who want undervalue stocks (Hong Kong Land, Capitaland, UOL, Keppel Land) to buy at bottom but need to keep a close eye on the chart.