IBM: Trade Ideas

  • Post author:

IBM is going to announce quarterly earning on Jan 21 AMC. Expect some big move on Dow Jones Industrial and S&P500 when market opens on Jan 22 as IBM has very heavy weightage on these two indices.

There are a few trade ideas after the earning.

  • Iron Condor:  Sell Vega as IV percentile is high at 72.38%.
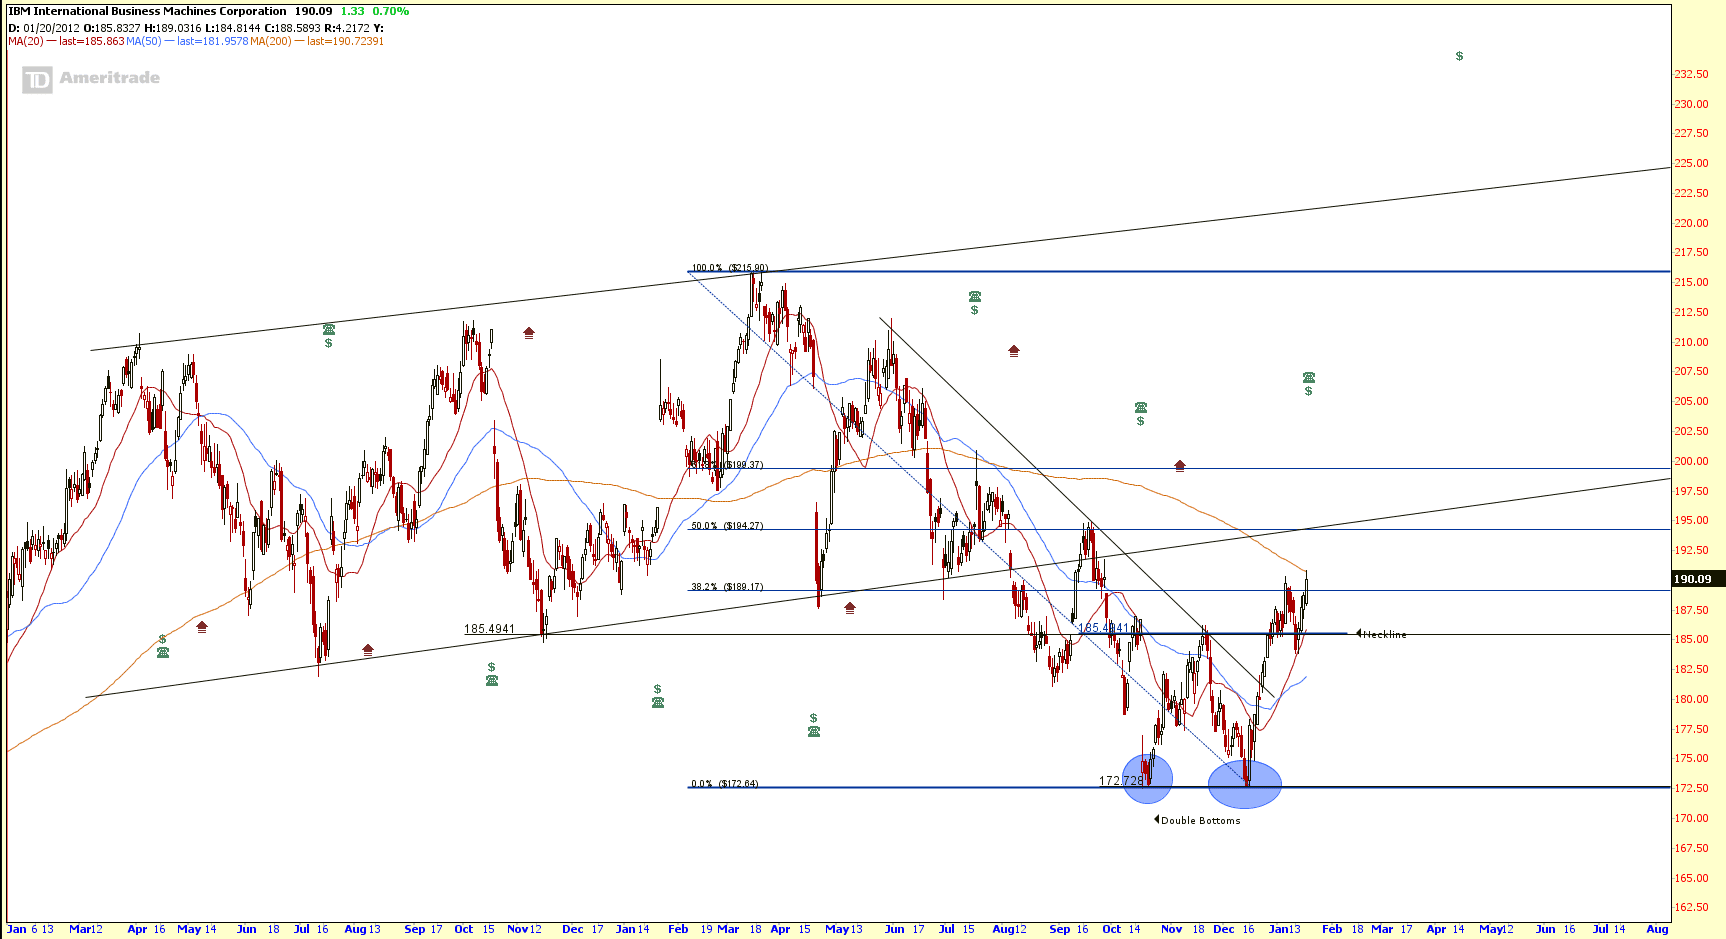
  • Short Vertical Put Spread: IBM has broken out from a Double Bottoms and tested the neckline at about $185. This is a reversal pattern and IBM may start an uptrend if there is no shock news from earning announcement.
  • Short Vertical Put Spread: If there is a gap down due to poor earning or poor outlook guidance, IBM will resume the down trend.

IBM Technical Analysis

IBM Jan 19-2014

IBM Implied Volatility
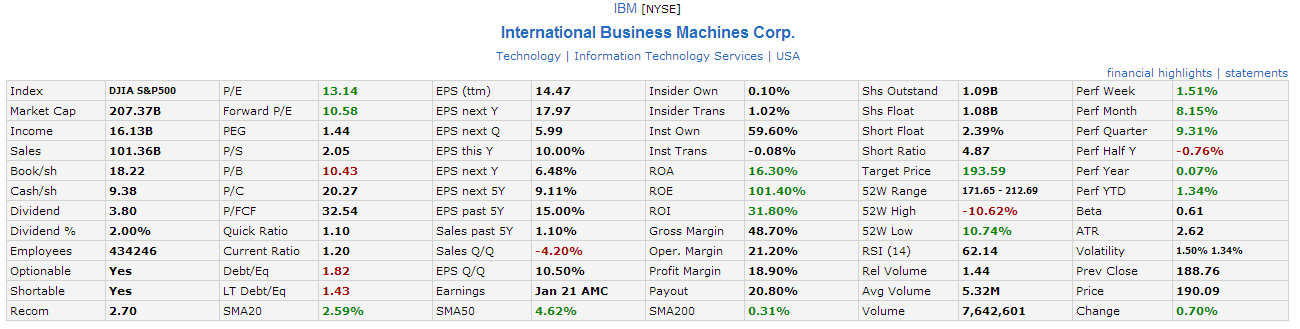
IBM IV Jan19-2014

IBM Fundamental

IBM Fundamental Analysis Jan19-2014


There are many requests for me to conduct class on how to analyse US Stocks.  I have designed a syllabus on “How to trade US Stocks” and also introduction of Option Trading. You may check the sign up information and syllabus here. This is a hands on class focus on application, stock research & setting up trading plan for US Stocks. I will be using thinkorswim platform to teach. You may open a FREE Demo account here.

Original post by Marubozu from My Stocks Investing Journey.

Continue ReadingIBM: Trade Ideas

First Resources: Watch the Support!

  • Post author:

First Resources is forming a Descending Triangle and currently testing the $2.00 critical support. More down side if this support is broken. Currently MACD is in bearish territory. Next immediate support zone (resistance turned support) is between $1.90 and $1.95.

2014Jan18-FirstRes-800x600

Original post by Marubozu @ My Stocks Investing Journey.


Current P/E Ratio (ttm) 10.9993
Estimated P/E(12/2013) 12.2491
Relative P/E vs. FSSTI 0.8219
Earnings Per Share (USD) (ttm) 0.1425
Est. EPS (USD) (12/2013) 0.1280
Est. PEG Ratio 1.3686
Market Cap (M SGD) 3,168.15
Shares Outstanding (M) 1,584.07
30 Day Average Volume 1,557,267
Price/Book (mrq) 2.5395
Price/Sale (ttm) 4.2698
Dividend Indicated Gross Yield 2.00%
Cash Dividend (SGD) 0.0125
Dividend Ex-Date 08/29/2013
5 Year Dividend Growth 23.36%
Next Earnings Announcement 02/27/2014
Continue ReadingFirst Resources: Watch the Support!

Six ratios say this market is very overbought

  • Post author:

By Mark Hulbert, MarketWatch.


The U.S. stock market is more overvalued than it was at the majority of the past century’s peaks, according to six well-known valuation ratios.
That doesn’t mean the bull market is coming to an end, of course, since some past bull markets were even more overvalued when they topped out. Furthermore, no two market peaks behave the same way.
2014 Stock Market Overbought

Nevertheless, the evidence suggests that risks are high. You may want to consider selling some of your stock holdings and building up cash.


To compare current valuations to those that prevailed at past market tops, I relied on a comprehensive list of past bull-market tops compiled by Ned Davis Research. The list is based on a set of criteria focusing on the speed, magnitude and length of market movements.According to the firm, there have been 35 bull-market tops since 1900. The Dow Jones Industrial Average lost an average of 31% in the bear markets that followed.Here’s how the market stacks up to past market tops according to these six valuation ratios.

  1. Price/earnings ratio. Calculated by dividing stock price by earnings per share, this is perhaps the most widely followed of all valuation ratios. Based on the previous 12 months’ earnings, the S&P 500’s current P/E ratio is 18.6, which is higher than those that prevailed at 24 of the 35 bull market tops since 1900. (Data before 1957 are for the S&P Composite Stock Index, since the S&P 500 didn’t exist yet.)
  2. Cyclically adjusted P/E ratio. This is the version of the P/E championed by Yale University Professor Robert Shiller, the recent Nobel laureate in economics. It is calculated by dividing a company’s stock price by the average of its inflation-adjusted earnings of the preceding decade. For the S&P 500, this ratio currently stands at 25.6, which is higher than what prevailed at 29 of the 35 tops since 1900.
  3. Dividend yield. This is the percentage of a company’s stock price that is represented by its total annual dividends. Since this yield tends to fall as prices rise, and vice versa, the market should register some of its lowest readings near its tops. The S&P 500’s yield currently stands at 2.0%, which is lower than the comparable yields that prevailed at all but five of the bull-market tops since 1900.
  4. Price/sales ratio. This is calculated by dividing a company’s stock price by its per-share sales. Though it is lesser known, it still is championed by many investors because it is based on data that are less susceptible to manipulation than earnings. For the S&P 500, the price/sales ratio currently stands at 1.6, which is higher than the comparable readings that prevailed at all but two of the bull market tops since 1955, which is how far back data are available.
  5. Price/book ratio. This is another lesser-known valuation indicator, calculated by dividing a company’s stock price by its per-share book value—an accounting measure of net worth. For the S&P 500, this ratio currently stands at 2.7, which is higher than all but five of the 28 bull-market tops since the mid-1920s, which is how far back data are available.
  6. “Q” ratio. This indicator is based on research conducted by the late James Tobin, the 1981 Nobel laureate in economics. It is similar to the price/book ratio, except that book value is substituted by the replacement cost of assets.

Mr. Tobin thought this to be superior since he considered replacement cost to be better reflection of a company’s net worth than book value, which is based on assets’ original cost — no matter how far in the past those assets were acquired.

The Q ratio currently is higher than what prevailed at 31 of the 35 past market tops, according to data compiled by Stephen Wright, an economics professor at the University of London, and Andrew Smithers, founder of the U.K.-based economics-consulting firm Smithers & Co.
While each of these valuation ratios has its detractors, it is noteworthy that all six of them are currently telling a similar story. It is also worth noting that a particularly bearish message is coming from the two that, according to Messrs. Smithers and Wright, have the best historical track record — the Q ratio and the Shiller P/E.
If you agree with this bearish assessment, you should be thinking of ways to build up cash in your portfolio. At a minimum, you shouldn’t automatically reinvest the proceeds when you sell any existing stock positions.
Market timing is notoriously difficult, however, so you might choose to stick with your stock positions through thick and thin. In that event, you could still begin to shift your stock holdings toward sectors that historically have performed the best near the end of a bull market.
According to Ned Davis Research, those sectors tend to be consumer discretionary and consumer staples. Two exchange-traded funds benchmarked to those sectors are the Consumer Discretionary Select Sector SPDR XLY +0.45%  and the Consumer Staples Select Sector SPDR XLP +0.78% . They both charge annual fees of 0.18%, or $18 per $10,000 invested.
Here are the stocks in these two sectors that are most popular right now among the advisers tracked by the Hulbert Financial Digest who have beaten the stock market over the past 15 years: satellite-television provider DirecTV DTV -0.28% ; entertainment giant Walt Disney DIS -0.31% ; Kimberly-Clark KMB -.00% , the consumer-products company; fast-food giant McDonald’s MCD -1.18% ; drug distributor McKesson MCK -.00% ; PepsiCoPEP -0.80% , the beverage company; and Philip Morris International PM  -1.41% , the cigarette manufacturer. 

Mark Hulbert is the founder of Hulbert Financial Digest in Chapel Hill, N.C. He has been tracking the advice of more than 160 financial newsletters since 1980. Follow him on Twitter @MktwHulbert.


Extract from Marketwatch

Continue ReadingSix ratios say this market is very overbought